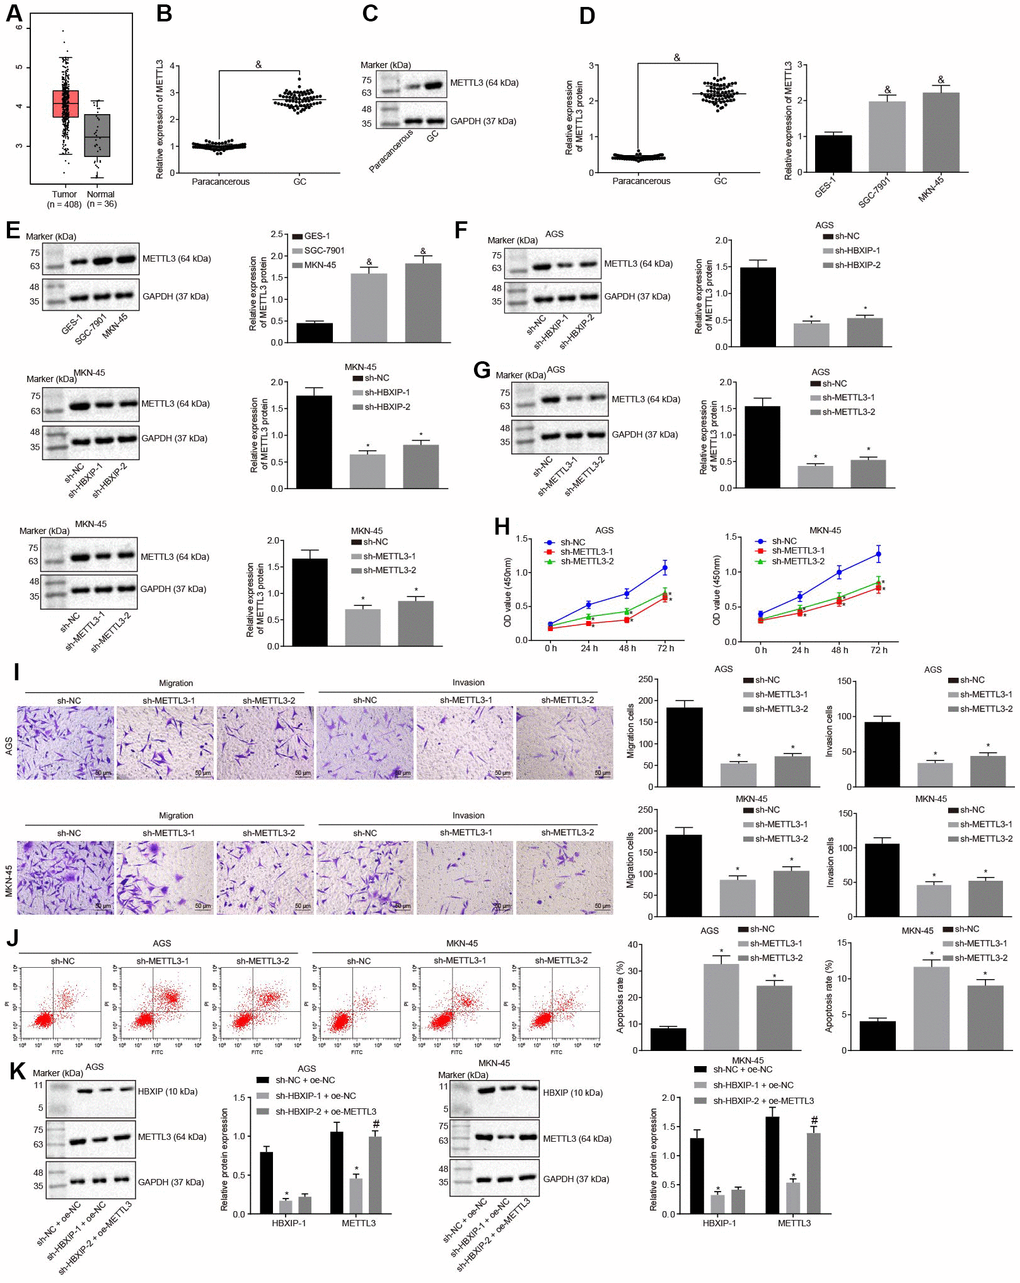
Figure 3.Silencing HBXIP diminishes the expression pattern of METTL3 and inhibits GC cell viability, migration and invasion, and induces apoptosis. (A) Expression pattern of METTL3 in GC as shown in the TCGA database. The left red box diagram represents tumor samples, and the right gray box diagram indicates normal samples. The numbers of tumor samples and normal samples are marked below. (B and C), METTL3 mRNA expression and protein expression patterns in GC and paracancerous tissues were determined by RT-qPCR (B) and Western blot analysis (C), normalized to GAPDH, & p < 0.05 vs. the paracancerous tissues. D and E, METTL3 mRNA expression and protein expression in GC cells were determined by RT-qPCR (D) and Western blot analysis (E), normalized to GAPDH, & p < 0.05 vs. the GES-1 cells. (F) METTL3 protein expression examined by Western blot analysis after silencing HBXIP, normalized to GAPDH. G, METTL3 protein expression examined by Western blot analysis after silencing METTL3, normalized to GAPDH. (H) Viability of AGS and MKN-45 cells examined by CCK-8 assay upon METTL3 silencing. (I) Migration and invasion of AGS and MKN-45 cells were examined by Transwell assay upon METTL3 silencing (× 200). (J) Apoptosis of AGS and MKN-45 cells examined by flow cytometry upon METTL3 silencing. (K) Representative Western blots of METTL3 and HBXIP proteins and their quantitation in AGS and MKN-45 cells upon HBXIP silencing or combined with METTL3 overexpression, normalized to GAPDH.
(L) Viability of AGS and MKN-45 cells examined by CCK-8 assay upon HBXIP silencing or combined with METTL3 overexpression. (M) Migration and invasion of AGS and MKN-45 cells were examined by Transwell assay upon HBXIP silencing or combined with METTL3 overexpression (× 200). (N) Apoptosis of AGS and MKN-45 cells examined by flow cytometry upon HBXIP silencing or combined with METTL3 overexpression. * p < 0.05 vs. the sh-NC or sh-NC and oe-NC group (AGS or MKN-45 cells treated with sh-NC or both sh-NC and oe-NC). # p < 0.05 vs. the sh-HBXIP and oe-NC group (AGS or MKN-45 cells treated with both sh-HBXIP and oe-NC). The above results were measurement data, and expressed as mean ± standard deviation. Data in panels B and C were compared by paired t test, in panels (D–G, I–K, M and N) were analyzed by one-way ANOVA with Tukey’s post hoc test, and in panels H and L by repeated measures ANOVA with Bonferroni post hoc test. The cell experiment was repeated 3 times independently.