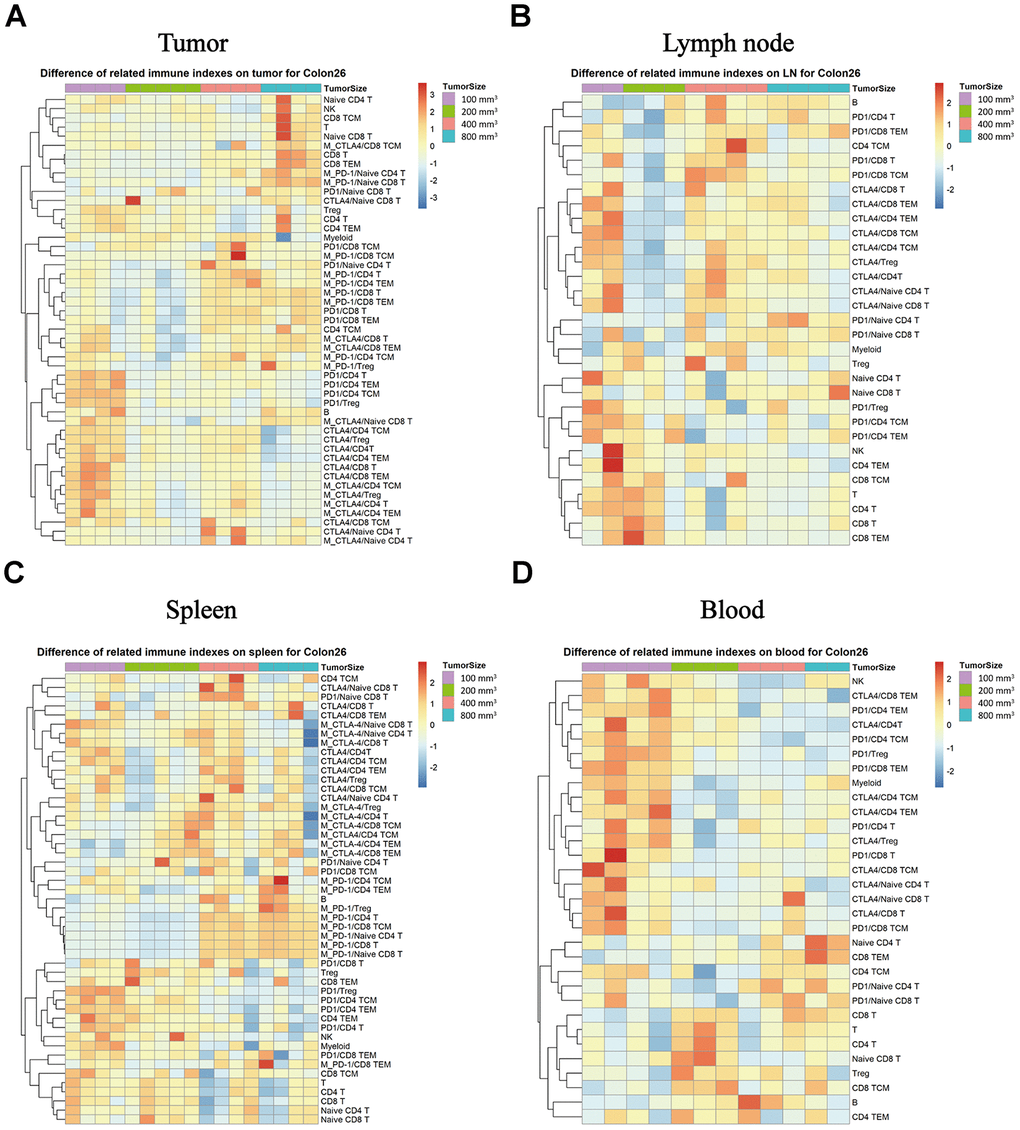
Figure 6.Expression of the PD-1 and CTLA-4 checkpoints in each subpopulation of different immune tissues at each stage of tumor progression. The different colors represent different levels of expression. The differential expression of PD-1 and CTLA-4 in immune cell subpopulations in different immune tissues isolated from the Colon26 animal model. Different expression levels of PD-1 and CTLA-4 in each subpopulation in TILs (A), lymph nodes (B), spleen (C), and peripheral blood samples (D) in the Colon26 animal model. The statistical analysis in this figure was obtained by analyzing the raw data. The dendrogram was plotted from the raw data of each subpopulation and biomarker using the R language.