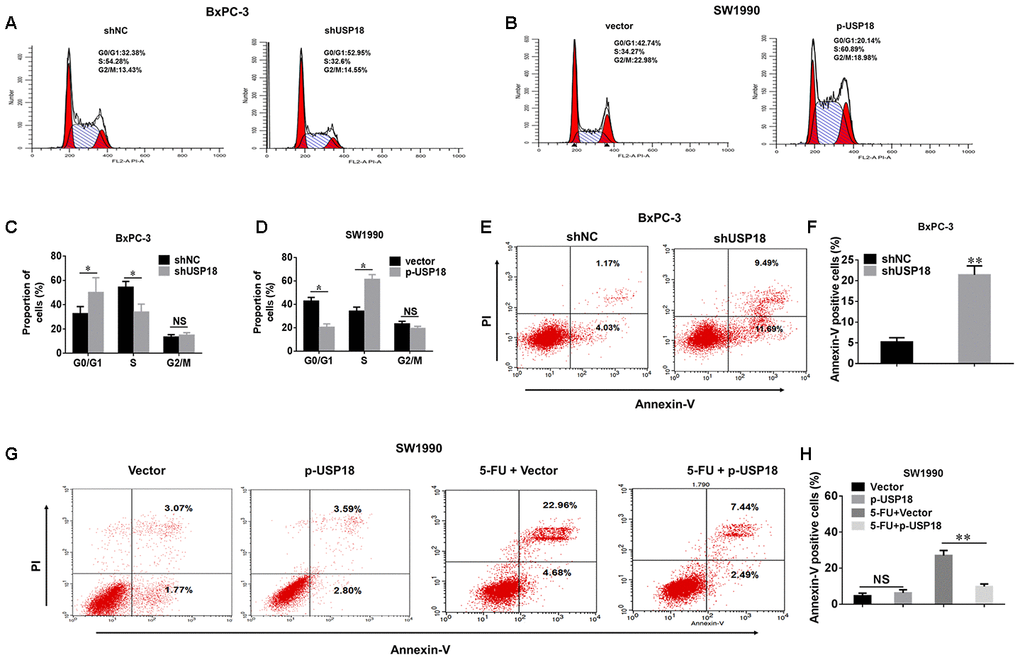
Figure 3.The effects of USP18 on pancreatic cancer cell growth. (A–D) Detection of cell cycle stage in BxPC-3/shUSP18 or SW1990/p-USP18 cells. Results are expressed as a peak diagram (A, B) and the calculated distribution of cells in G0/G1, S, and G2/M phases (C, D). *p<0.05. (E–H) Results are expressed as a scatter diagram and the calculated percentage of the annexin-V-positive cell population in different groups (*p<0.05).