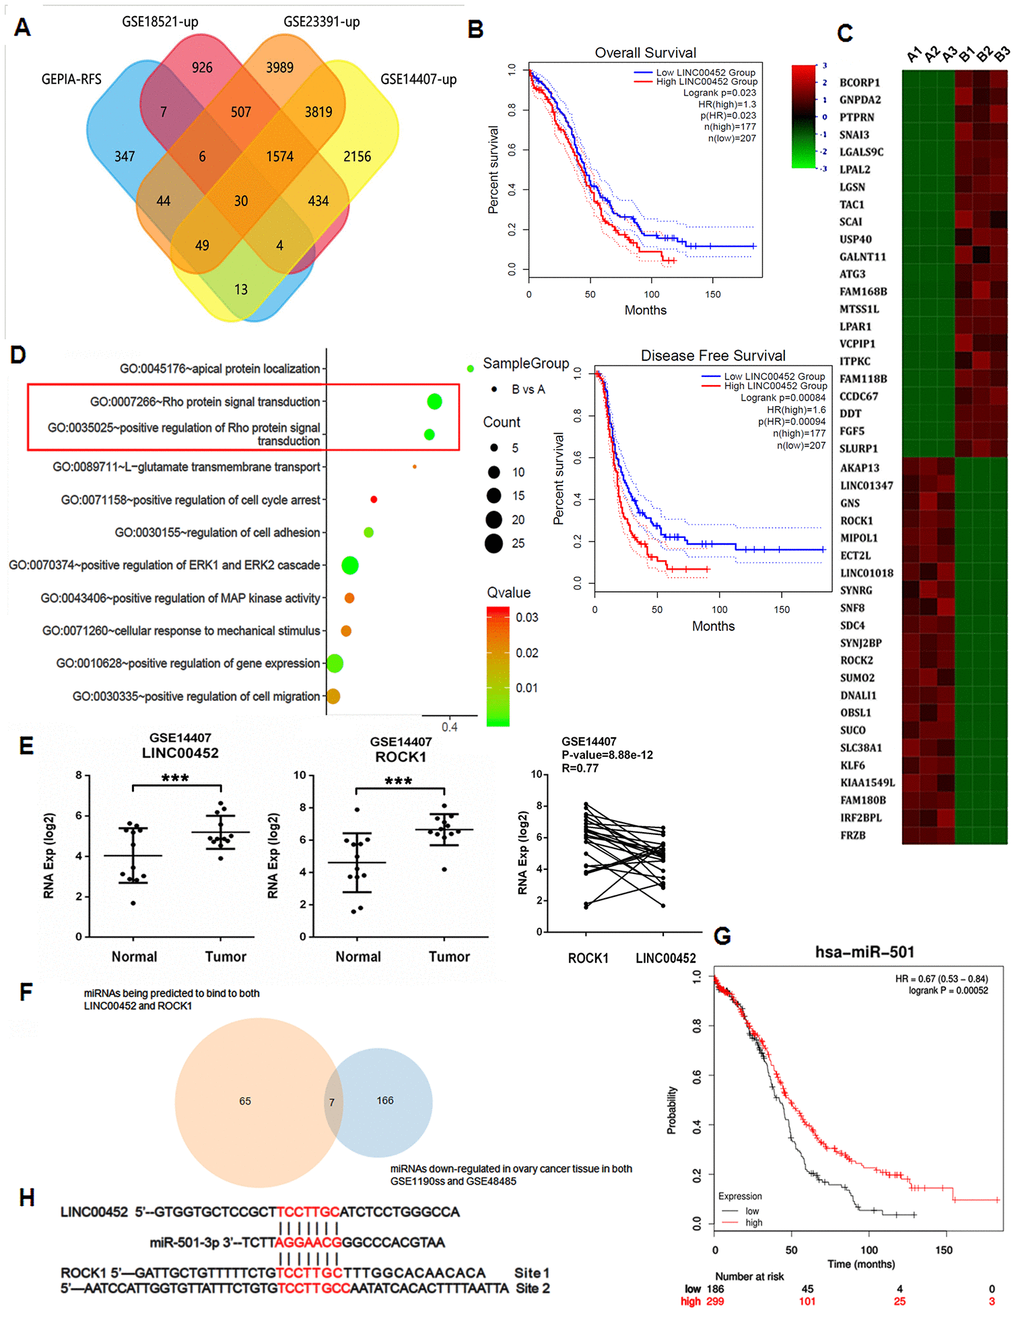
Figure 1.Aberrant LINC00452 expression in ovarian tumor tissue and cancer cells. (A) Venn diagram showing the overlapped genes being upregulated in ovarian tumor tissues and significantly associated with RFS. (B) Overall survival and RFS in ovarian cancer patients with higher LINC00452 level were shorter as demonstrated by Kaplan-Meier analysis. (C) Heatmap representation of the top differentially expressed genes (DEG) (2 < fold change < -2, p < 0.05) in LINC00452 knockdown (designated as group B) versus control (designated as group A) CaOV3 cells by microarray analysis. Color pattern represents row Z-score. (D) Bubble chart of enriched GOBP statistics. Rich factor is the ratio of the DEG number to the total number in a certain pathway. Q-value is a false discover rate corrected P-value ranging from 0 to 1. The color and size of the dots represent the range of the Q-value and the number of DEGs mapped to the indicated pathways, respectively. (E) LINC00452 and ROCK1 transcripts were elevated in ovarian tumor tissues compared with normal tissues, shown from microarray dataset GSE14407. Person’s correlation analysis showed a positive correlation in their expression in tumor. ***p < 0.001 versus normal tissues, student’s t-test. (F) Venn diagram showing the commonly downregulated miRNAs that are capable of binding to both LINC00452 and ROCK1 in ovarian tumors. (G) Survival curve of miR-501-3p in ovarian cancer patients. The overall survival in patients with lower miR-501-3p expression was shorter as indicated by Kaplan-Meier and log-rank tests. (H) Respective miR-501-3p binding sites in LINC00452 and ROCK1 as predicted in Targetscan database.