Submit an Article
Navigate
Home
Editorial Board
Editorial Policies
Current Volume
Archive
Scientific Integrity
Publication Ethics Statements
Interviews with Outstanding Authors
Newsroom
Sponsored Conferences
Podcast
Contact
Special Collections
Submit an Article
Online ISSN: 1945-4589
Research Paper
|
Volume 12, Issue 19
|
pp. 19221–19232
Association of physical activity with chronic kidney disease: a systematic review and dose-response meta-analysis
Back to article
Figure 2
(2 of 6)
−
100%
+
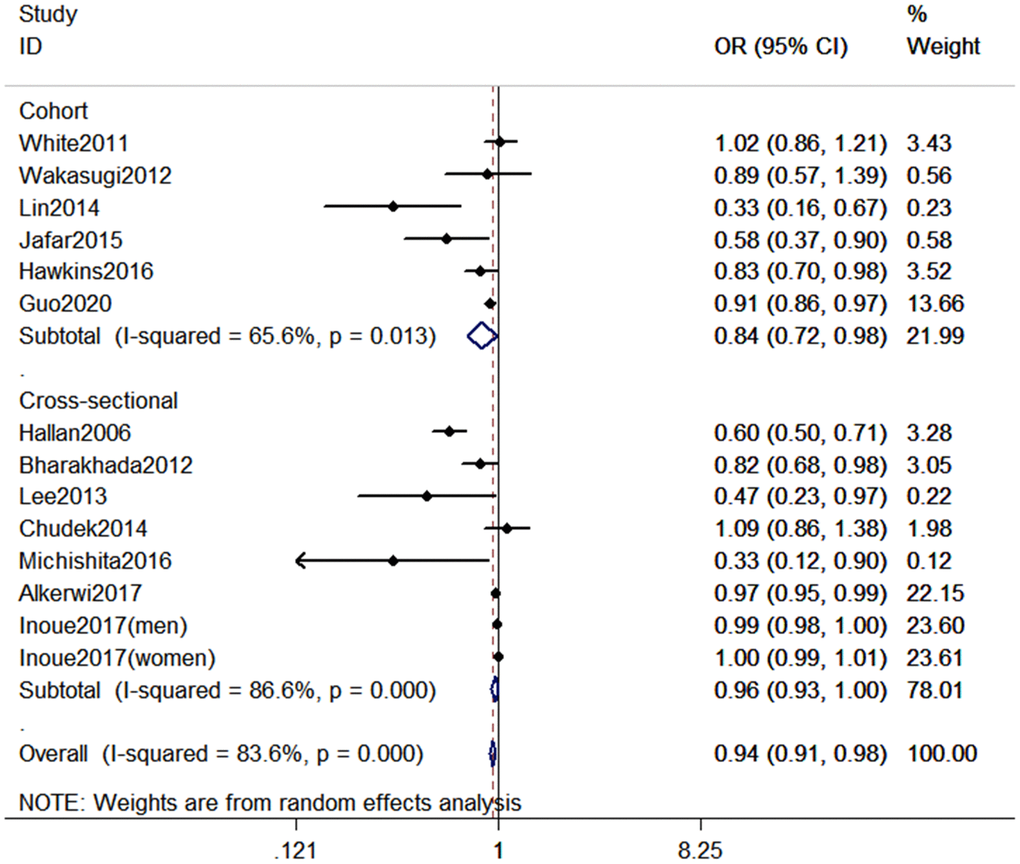
Figure 2.
Forest plot between highest vs. lowest level of PA and CKD risk.