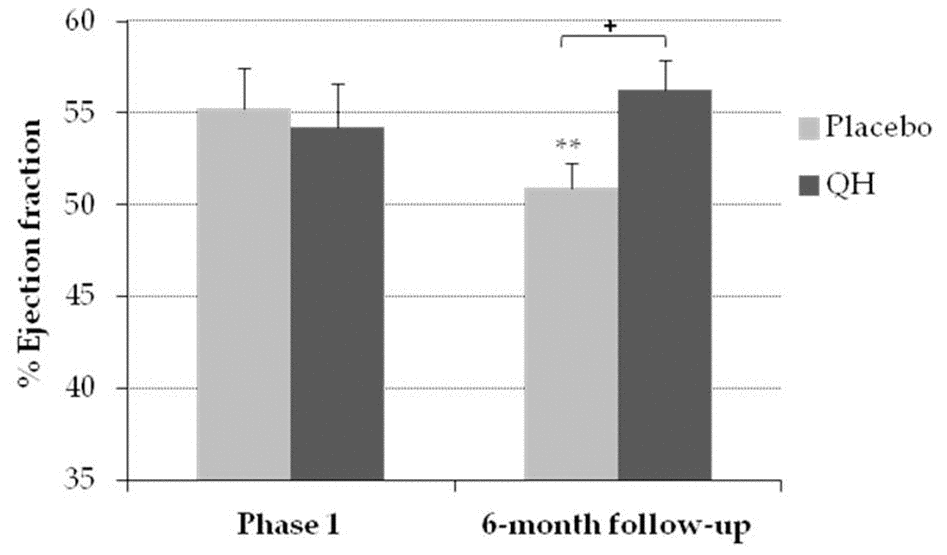
Figure 6.Percentage of ejection fraction in placebo (grey) and QH treated (black) group in phase 1 and following 6-month follow-up. **p≤0.01 significance of differences in each experimental group in comparison with phase 1; + p≤0.05 significance of differences between both groups in the follow-up.