Submit an Article
Navigate
Home
Editorial Board
Editorial Policies
Current Volume
Archive
Scientific Integrity
Publication Ethics Statements
Interviews with Outstanding Authors
Newsroom
Sponsored Conferences
Podcast
Contact
Special Collections
Submit an Article
Online ISSN: 1945-4589
Research Paper
|
Volume 12, Issue 15
|
pp. 15514–15531
Ubiquinol supplementation in elderly patients undergoing aortic valve replacement: biochemical and clinical aspects
Back to article
Figure 5
(5 of 8)
−
100%
+
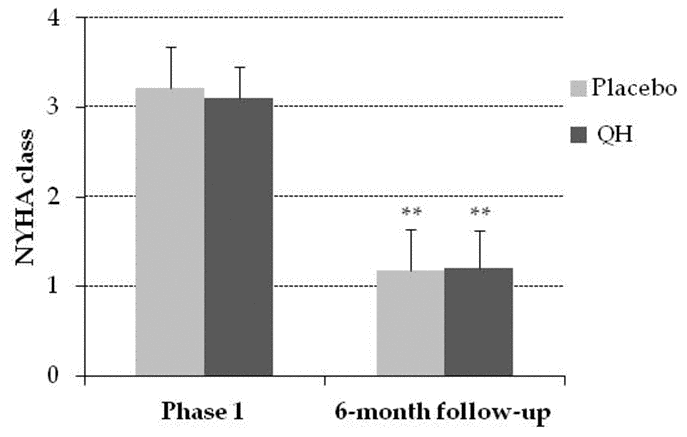
Figure 5.
NYHA class in placebo (grey) and QH treated (black) group in phase 1 and following 6-month follow-up.
**p≤0.01 significance of differences in each experimental group in comparison with phase 1.