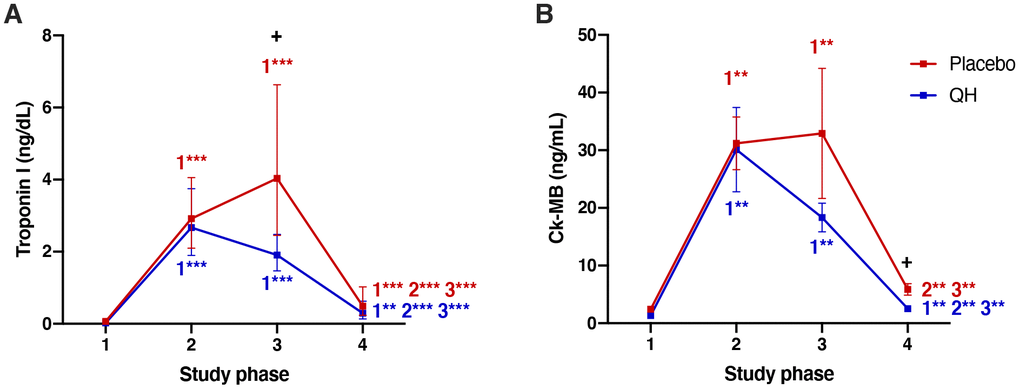
Figure 4.Troponin I (A) and Ck-MB (B) plasma levels in placebo (red) and QH treated (blue) groups during the four experimental phases. **p<0.01 and ***p<0.01 significance of differences in each experimental group in comparison with phase 1, 2 and 3 (c). + p<0.05 significance of differences comparing both groups at the same experimental phase.