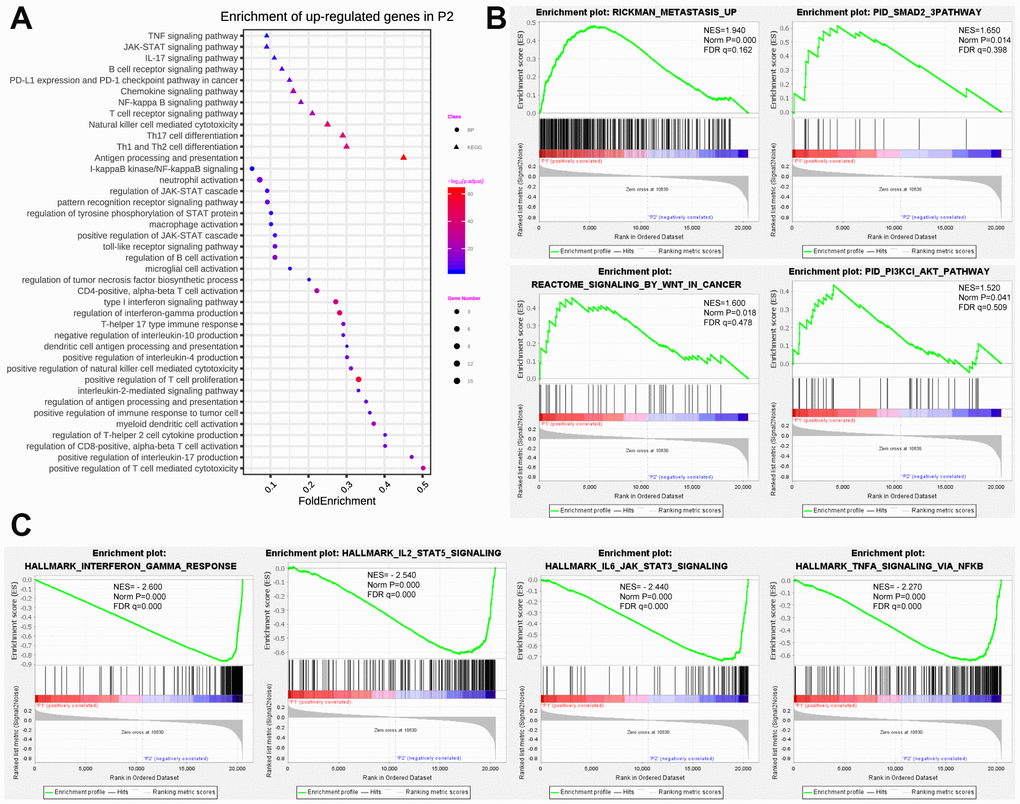
Figure 4.Functional annotation of differentially expressed genes in P1/P2 subgroups. (A) Functional annotation of up-regulated genes in P2 subgroup compared with P1 by using GO in terms of biological process (BP) and KEGG signaling pathway. (B) GSEA revealed that up-regulated genes in P1 subgroup were enriched for hallmarks of malignant tumors. (C) GSEA revealed that up-regulated genes in P2 subgroup were enriched for hallmarks of antitumor immune response.