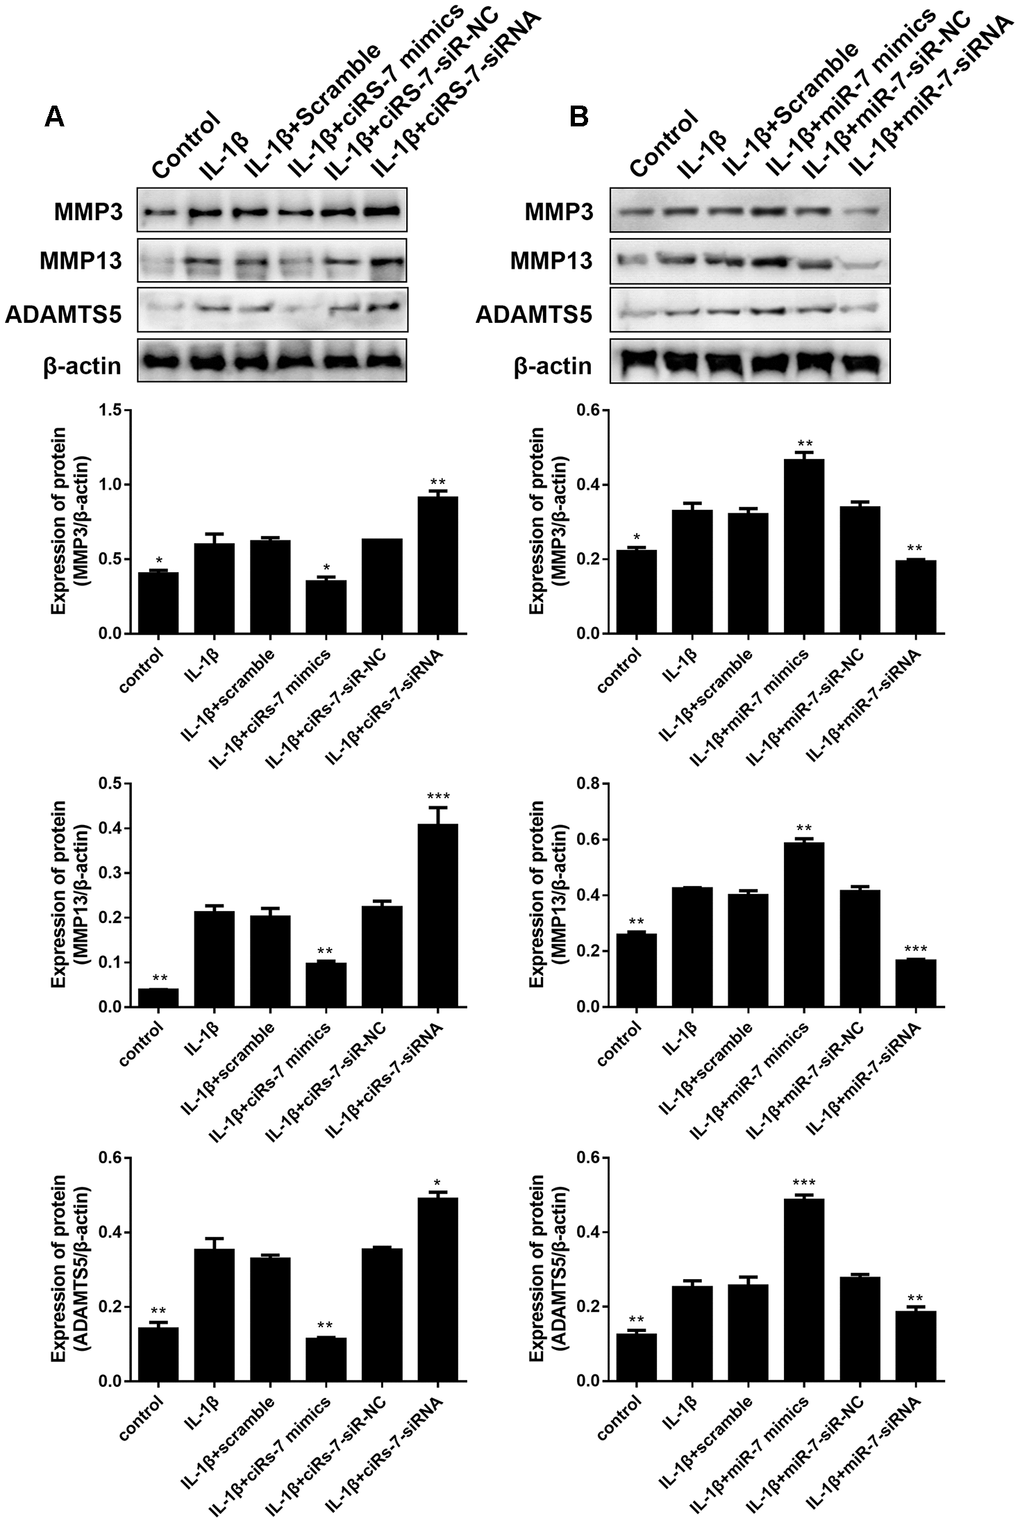
Figure 5.Effects of ciRS-7-related transfections (A) and miR-7-related transfections (B) on protein levels of cartilage-related MMP3, MMP13, and ADAMTS5. Data represent the mean ± SD (n=3), * p < 0.05, ** p < 0.01 and *** p < 0.001 vs. the IL-1β group.