Submit an Article
Navigate
Home
Editorial Board
Editorial Policies
Current Volume
Archive
Scientific Integrity
Publication Ethics Statements
Interviews with Outstanding Authors
Newsroom
Sponsored Conferences
Podcast
Contact
Special Collections
Submit an Article
Online ISSN: 1945-4589
Research Paper
|
Volume 12, Issue 20
|
pp. 20163–20183
Down-regulated ciRS-7/up-regulated miR-7 axis aggravated cartilage degradation and autophagy defection by PI3K/AKT/mTOR activation mediated by IL-17A in osteoarthritis
Back to article
Figure 13
(13 of 14)
−
100%
+
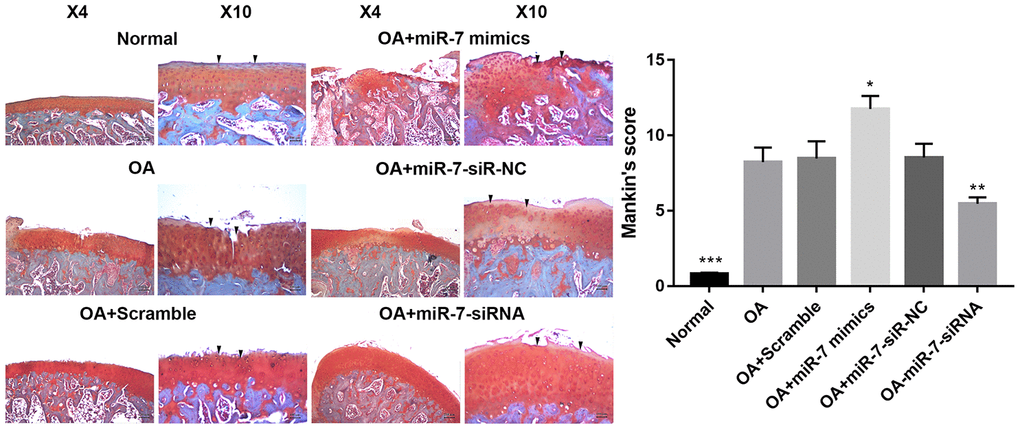
Figure 13.
Representative images of safranin O-stained rat knee joint sections with different treatments and the related Mankin’s scores of each group.
Data represent the mean ± SD (n = 10), *
p
< 0.05, **
p
< 0.01 and ***
p
< 0.001 vs. IL-1β group.