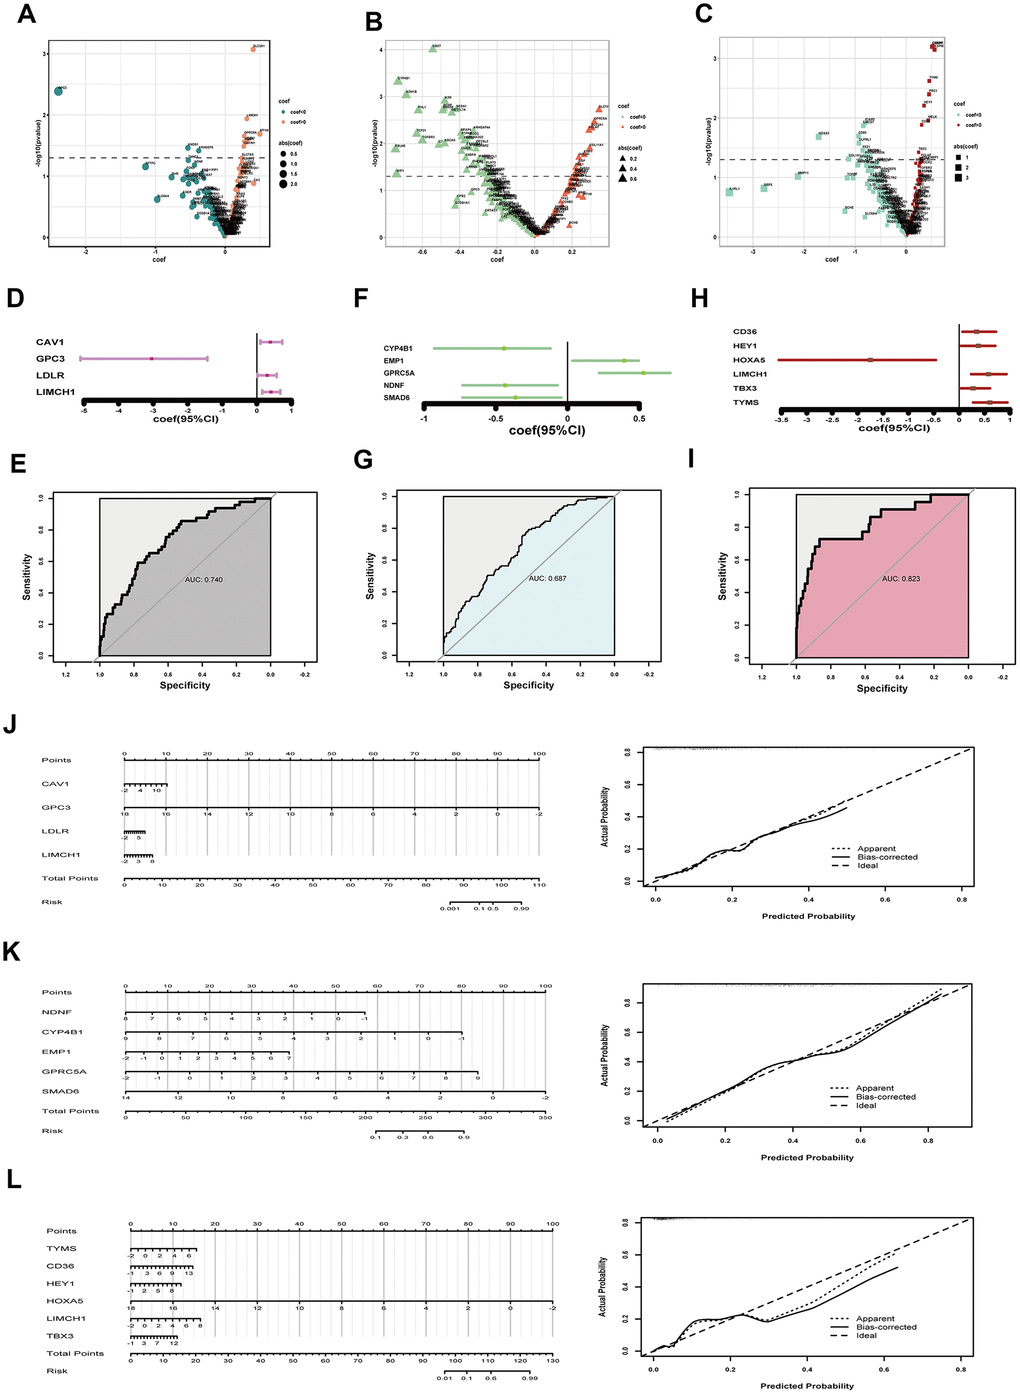
Figure 3.Assessing tumor size, lymph node invasion and distant metastasis. (A–C) coef and p value in univariate logistic regression analysis for tumor growth (A) lymph node invasion (B) and distant metastasis (C) respectively; (D) coef and 95% CI derived from the optimized model for tumor size; (E) ROC curve to show predictive potential of T-related model; (F) coef and 95% CI of the improved model for lymph node invasion; (G) ROC curve to exhibiting predictive efficacy of N parameter; (H) coef and 95% CI of the optimized model for distant metastasis; (I) ROC curve to exhibiting efficacy of M prediction; (J) Nomograph to assess T risk probability and corresponding calibration curve; (K) Nomograph to estimate lymph node invasion hazard and examination of efficacy; (L) Nomograph to assess distant metastasis risk and calibration curve showing model’s predictive potential. coef, coefficient; DEGs, differentially expressed genes; CI, confidence interval; ROC, receiver operating characteristic.