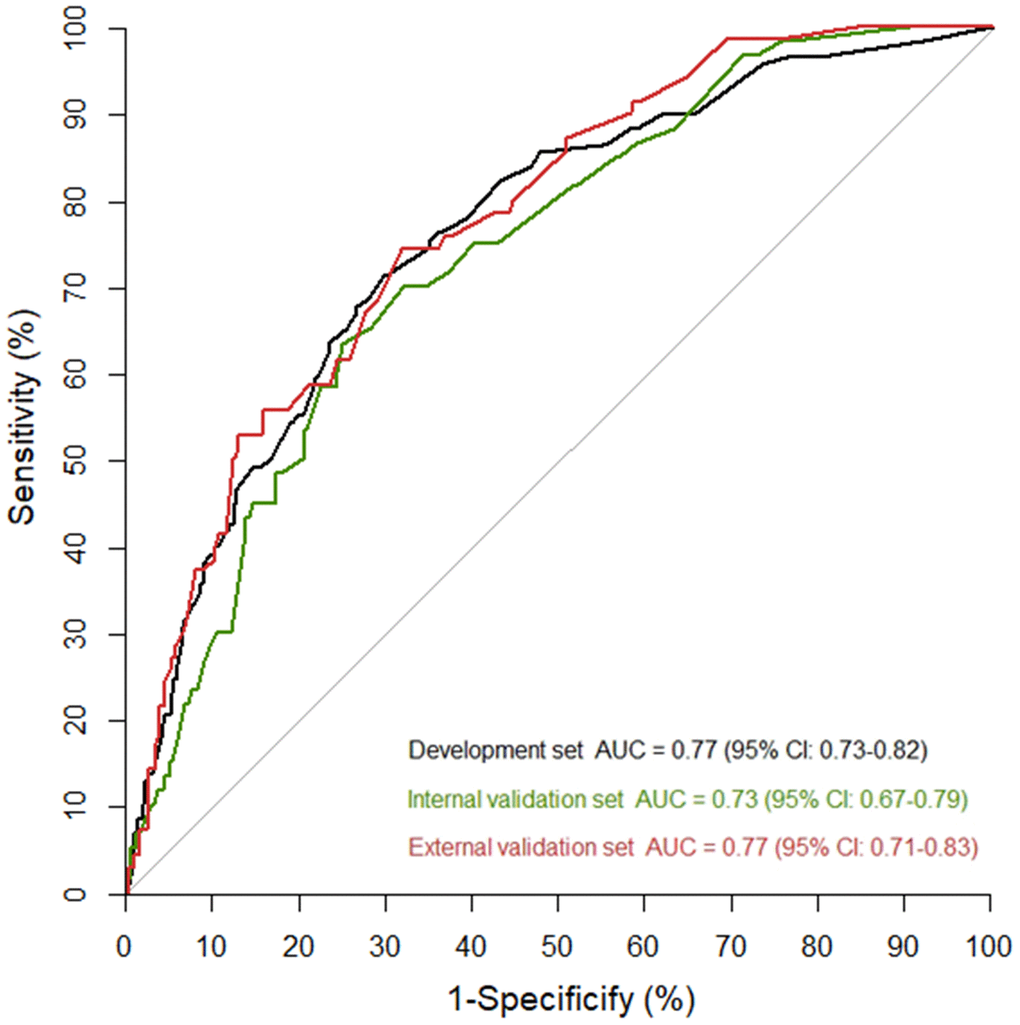
Figure 3.Areas under the curve (AUC) in the nomogram model for predicting the risk of critically ill cases among COVID-19 patients in the development and validation cohorts.
Figure 3 — Development and validation of a prediction model for early identification of critically ill elderly COVID-19 patients | Aging