Submit an Article
Navigate
Home
Editorial Board
Editorial Policies
Current Volume
Archive
Scientific Integrity
Publication Ethics Statements
Interviews with Outstanding Authors
Newsroom
Sponsored Conferences
Podcast
Contact
Special Collections
Submit an Article
Online ISSN: 1945-4589
Research Paper
|
Volume 12, Issue 19
|
pp. 19129–19146
Development and validation of a survival model for thyroid carcinoma based on autophagy-associated genes
Back to article
Figure 9
(9 of 13)
−
100%
+
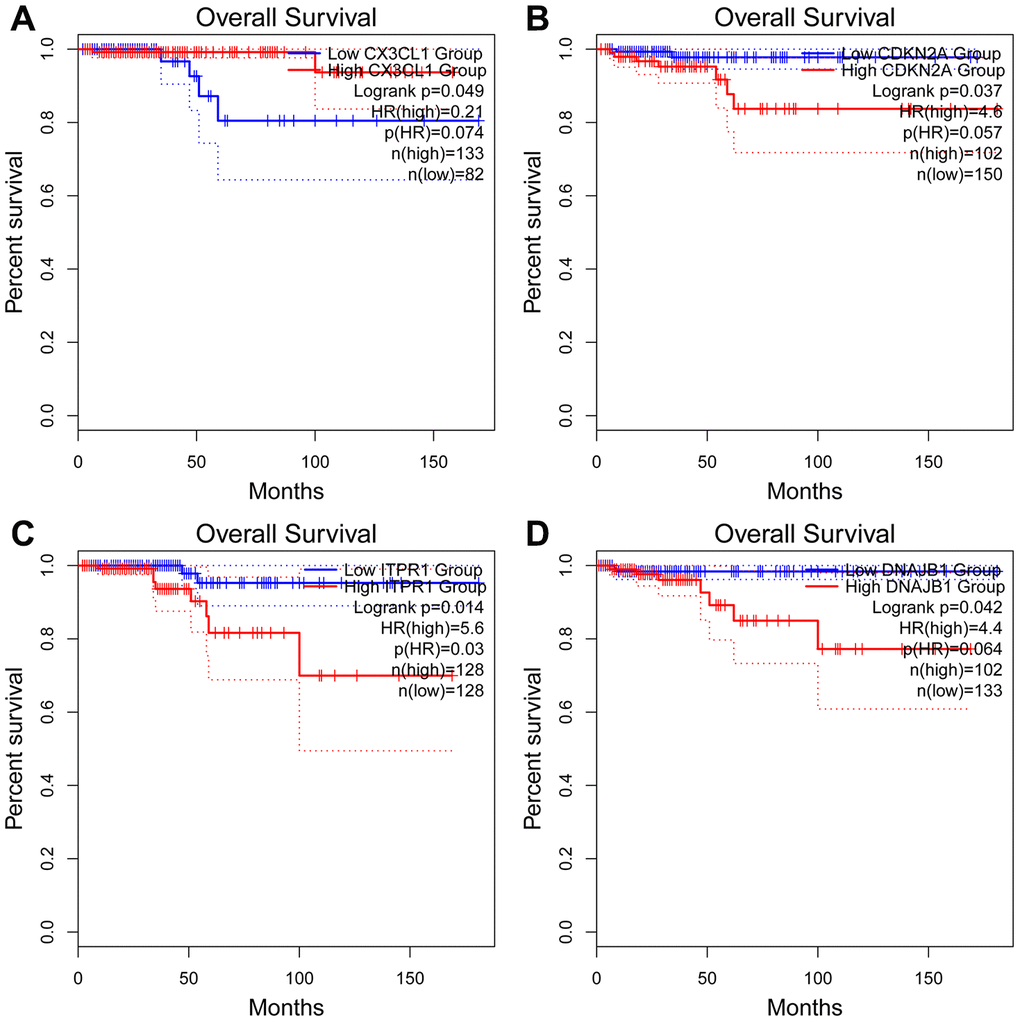
Figure 9.
Kaplan-Meier analyses of ARGs in the risk model.
Kaplan-Meier analyses of (
A
)
CX3CL1
, (
B
)
CDKN2A
, (
C
)
ITPR1
, and (
D
)
DNAJB1
. The statistical significance was determined by
the log-rank
test.