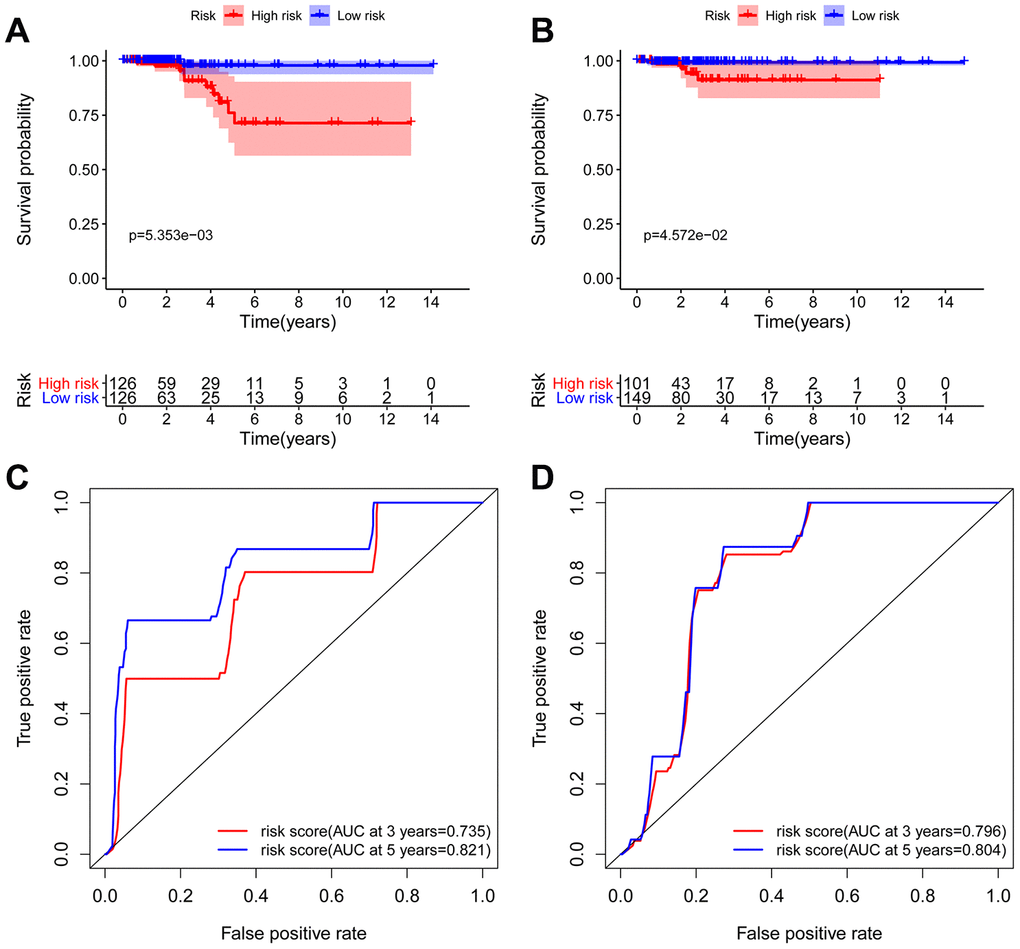
Figure 6.Kaplan-Meier and ROC analyses in the training and testing groups. Kaplan-Meier plot of the high-risk (red) and low-risk (blue) THCA patients in the training group (A) and testing group (B). The 3-year (red) and 5-year (blue) ROC curves of THCA patients in the training group (C) and testing group (D).