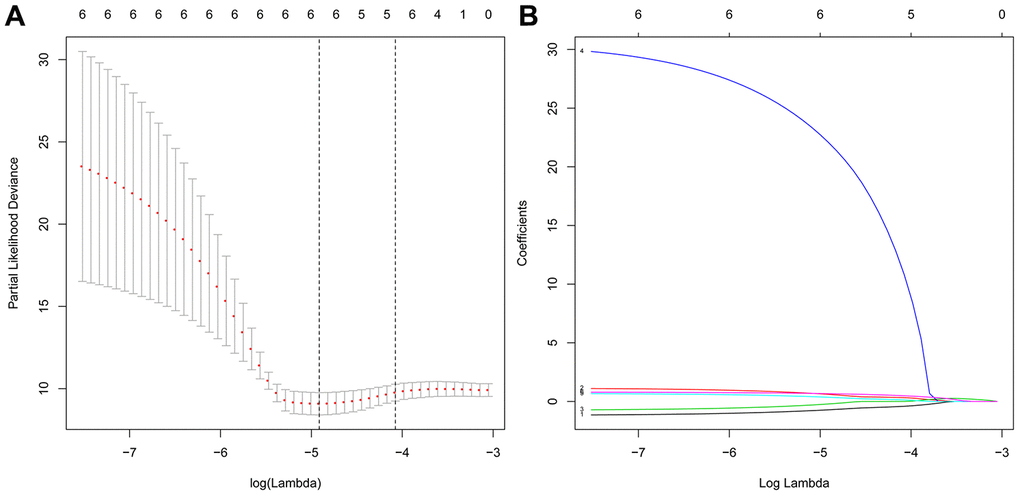
Figure 5.Screening of the optimal ARGs with prognostic potential by Lasso regression. (A) Screening of the optimal parameter (lambda) at which the vertical lines were drawn. (B) Lasso coefficient profiles of the six ARGs with nonzero coefficients determined by the optimal lambda.