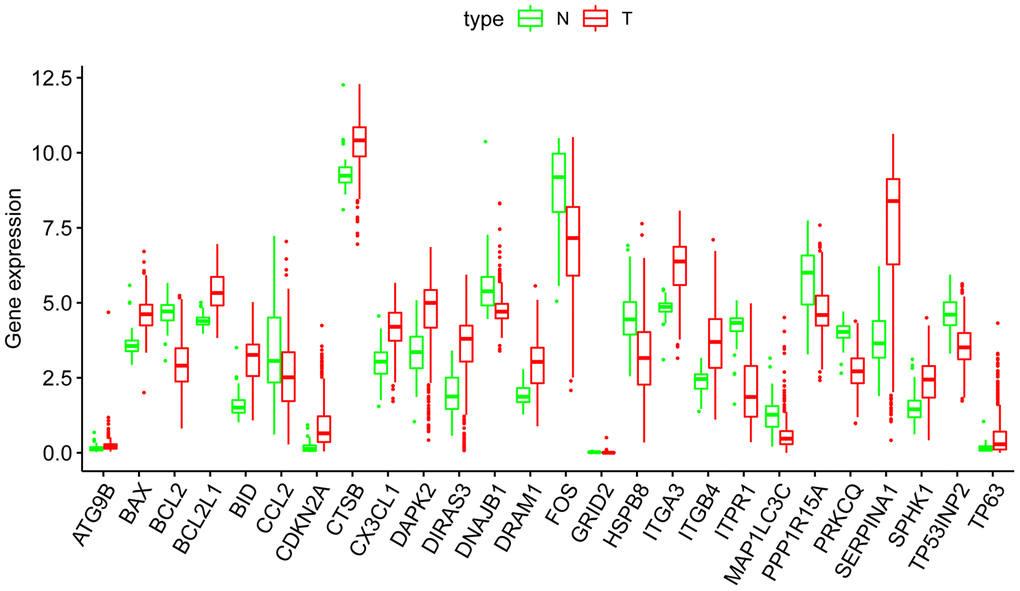
Figure 3.Boxplots of the expression levels of 26 autophagy-related genes (ARGs) in THCA and normal thyroid tissues. The red box plots above the corresponding gene name represent the expression in THCA, whereas the green box plots represent the expression in normal thyroid tissues.