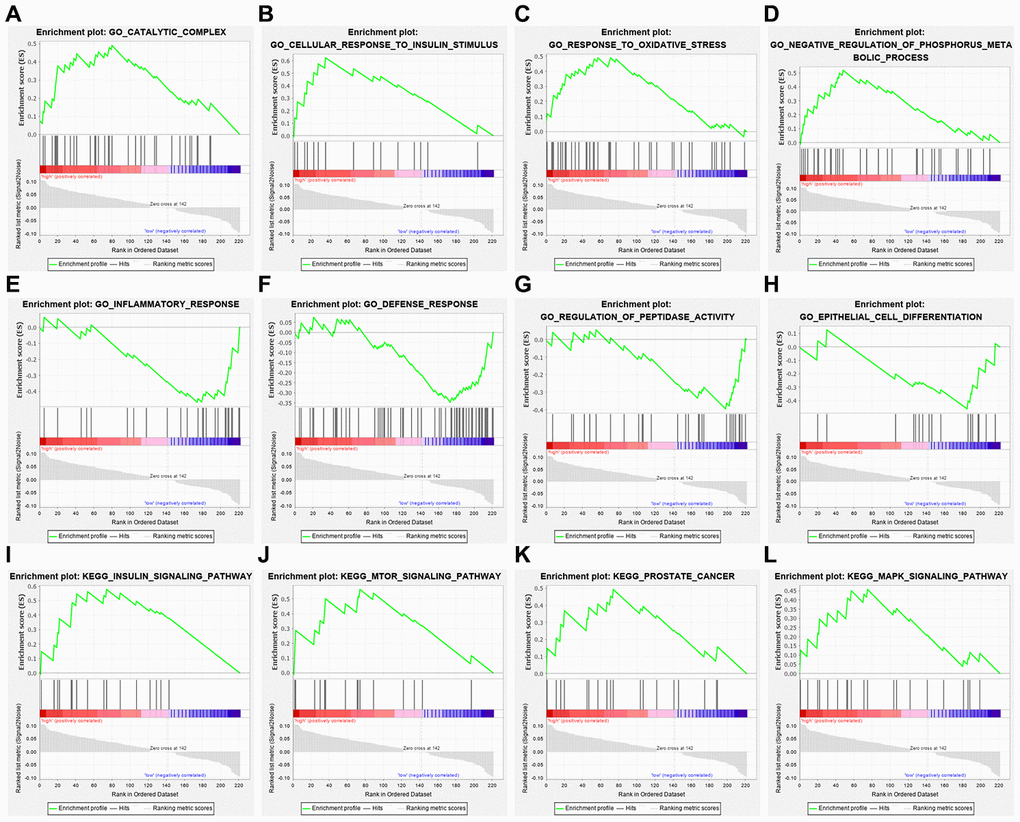
Figure 13.Gene set enrichment analysis of genes in high-risk and low-risk patients with THCA. (A–D) GO enrichment analysis results in the high-risk group. (E–H) GO enrichment analysis results in the low-risk group. (I–L) KEGG enrichment analysis results in the high-risk group.