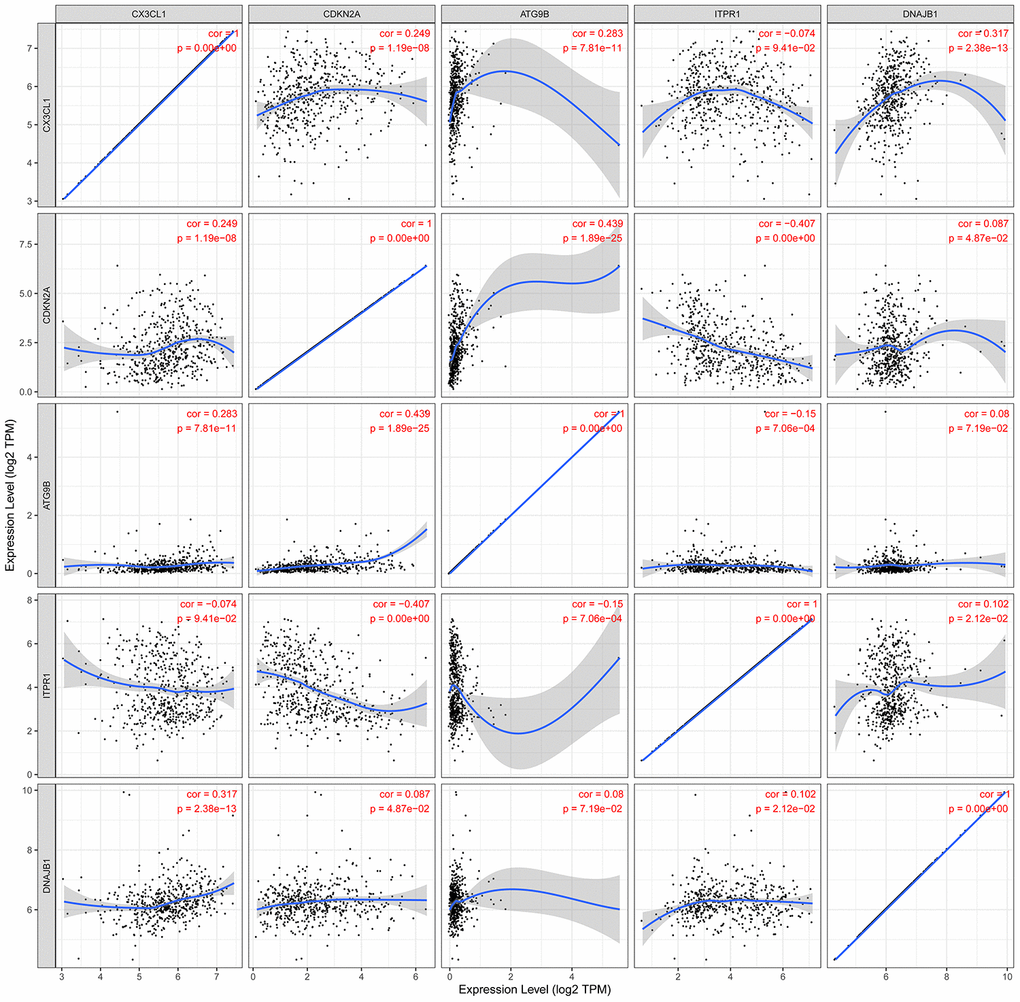
Figure 12.The relationships between the expression levels of the 5 ARGs in the autophagy prognostic model. Cor: Correlation coefficient. The value range of the correlation coefficient is (-1, 0) or (0, 1). When the value range is (-1, 0), it indicates a negative correlation; when the value range is (0, 1), it indicates a positive correlation.