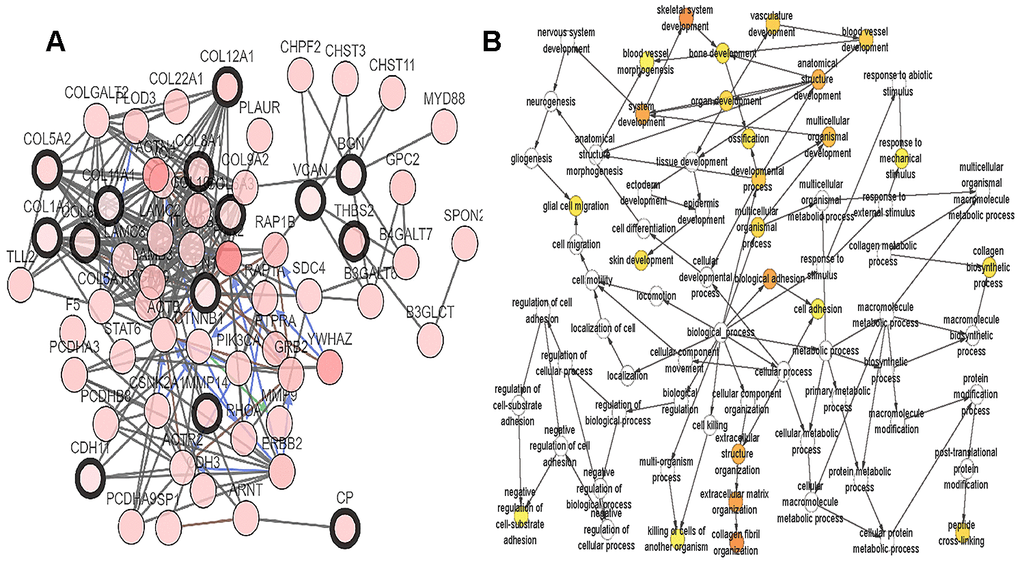
Figure 4.Interaction network and biological process analysis of the hub genes. (A) Hub genes and their co-expression genes were analyzed using cBioPortal. Nodes with bold black outline represent hub genes. Nodes with thin black outline represent the co-expression genes. (B) The biological process analysis of hub genes was constructed using BiNGO. The color depth of nodes refers to the corrected P-value of ontologies. The size of nodes refers to the numbers of genes that are involved in the ontologies. P<0.01 was considered statistically significant.