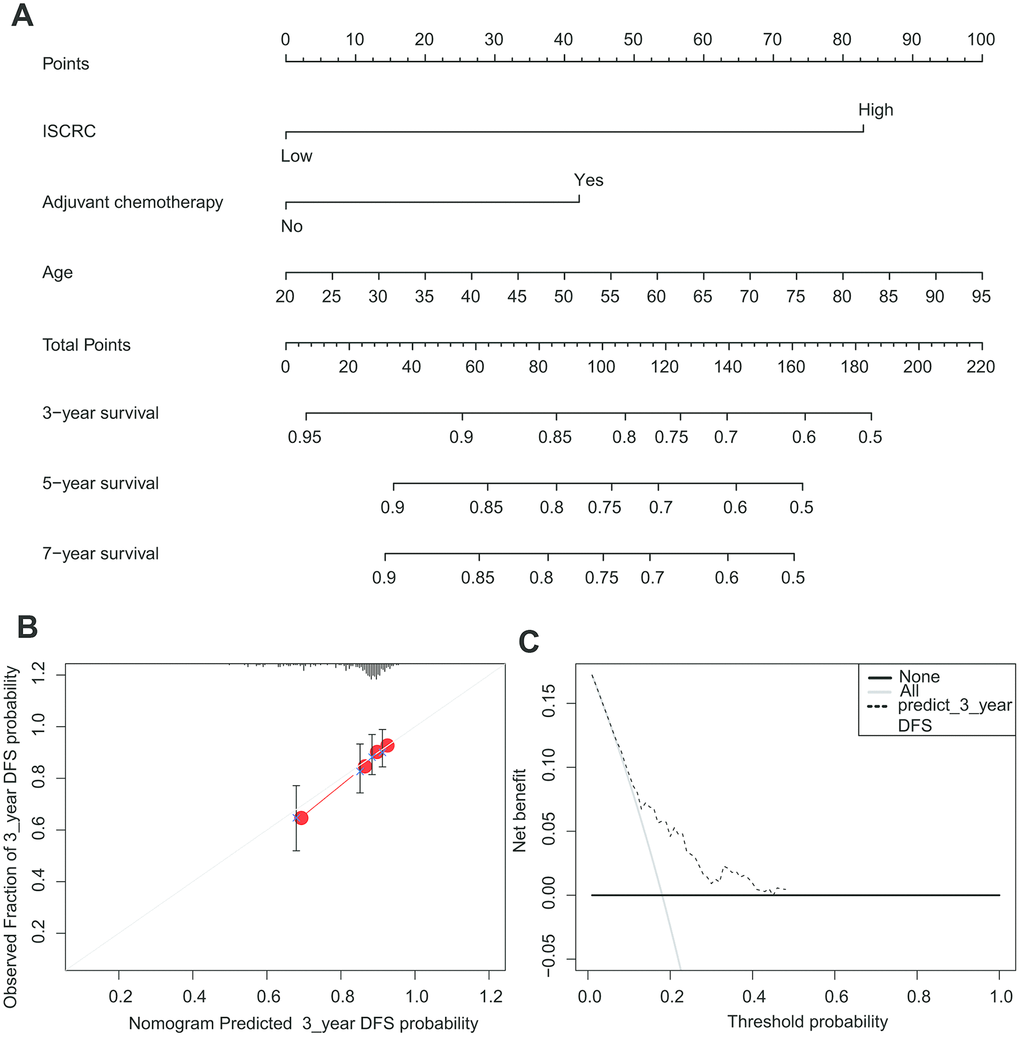
Figure 6.The nomogram to predict risk of cancer recurrence in GSE39582. (A) The nomogram for predicting proportion of patients with disease-free survival. (B) The calibration plots for predicting recurrence at 3 years. Nomogram-predicted probability of recurrence is plotted on the x-axis; actual recurrence is plotted on the y-axis. The solid line represents our nomogram and the vertical bars represent 95 percent confidence intervals. (C) ROC curve based on the nomogram for recurrence probability.