Submit an Article
Navigate
Home
Editorial Board
Editorial Policies
Current Volume
Archive
Scientific Integrity
Publication Ethics Statements
Interviews with Outstanding Authors
Newsroom
Sponsored Conferences
Podcast
Contact
Special Collections
Submit an Article
Online ISSN: 1945-4589
Research Paper
|
Volume 12, Issue 18
|
pp. 18322–18342
A two-gene-based prognostic signature for pancreatic cancer
Back to article
Figure 8
(8 of 8)
−
100%
+
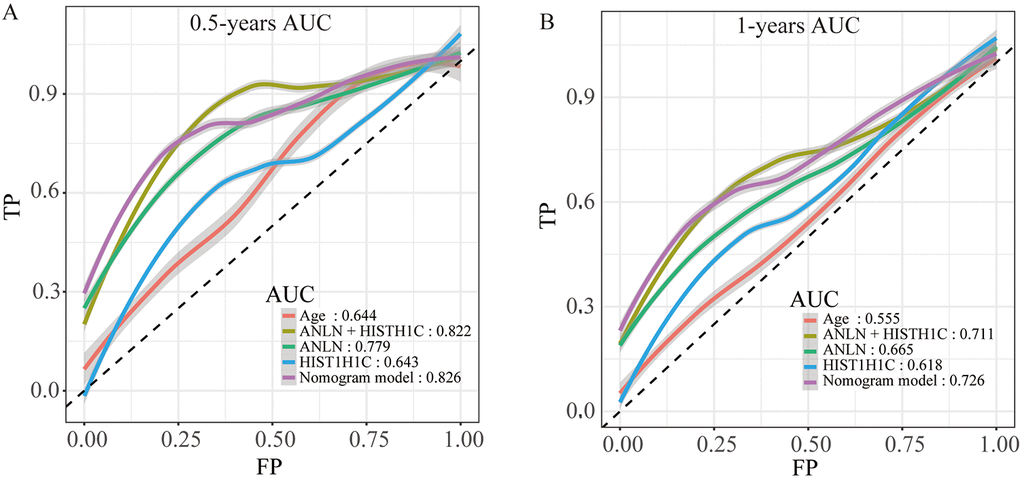
Figure 8.
The time-dependent ROC curves of the nomogram and single variables in the model predicting the overall survival after surgery at 0.5 years (
A
) and 1 year (
B
).