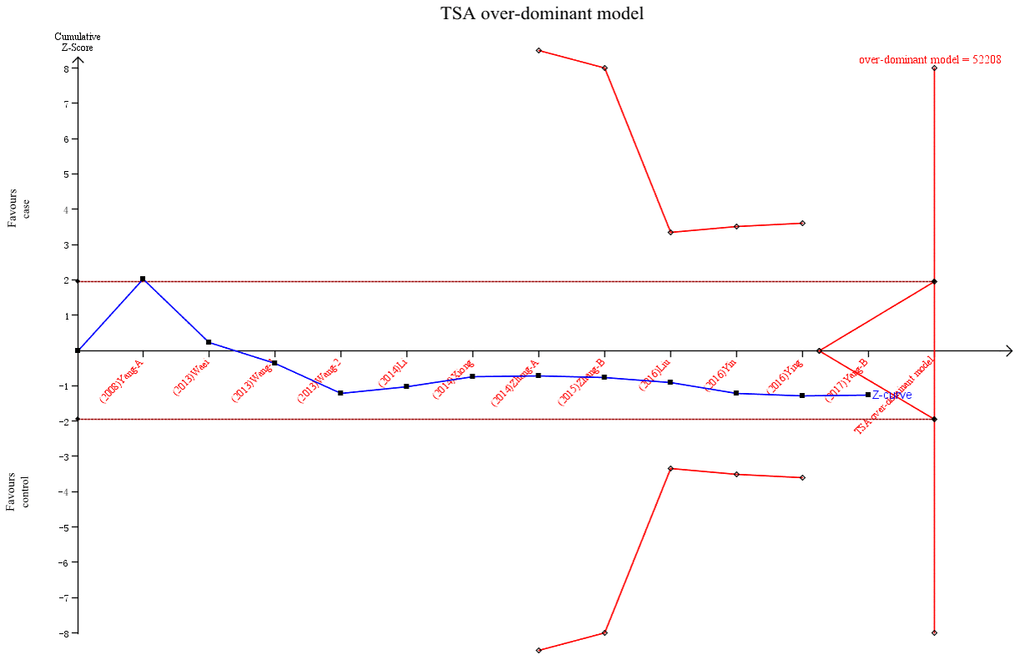
Figure 6.Trial sequential analysis of pri-miR-26a-1 rs7372209 C>T polymorphism and cancer risk in over-dominant model. The blue line represents the cumulative Z-score of the meta-analysis. The red straight represent the conventional P=0.05 statistical boundaries.