Submit an Article
Navigate
Home
Editorial Board
Editorial Policies
Current Volume
Archive
Scientific Integrity
Publication Ethics Statements
Interviews with Outstanding Authors
Newsroom
Sponsored Conferences
Podcast
Contact
Special Collections
Submit an Article
Online ISSN: 1945-4589
Research Paper
|
Volume 12, Issue 19
|
pp. 19060–19072
Association between the pri-miR-26a-1 rs7372209 C>T polymorphism and cancer susceptibility: multivariate analysis and trial sequential analysis
Back to article
Figure 5
(5 of 6)
−
100%
+
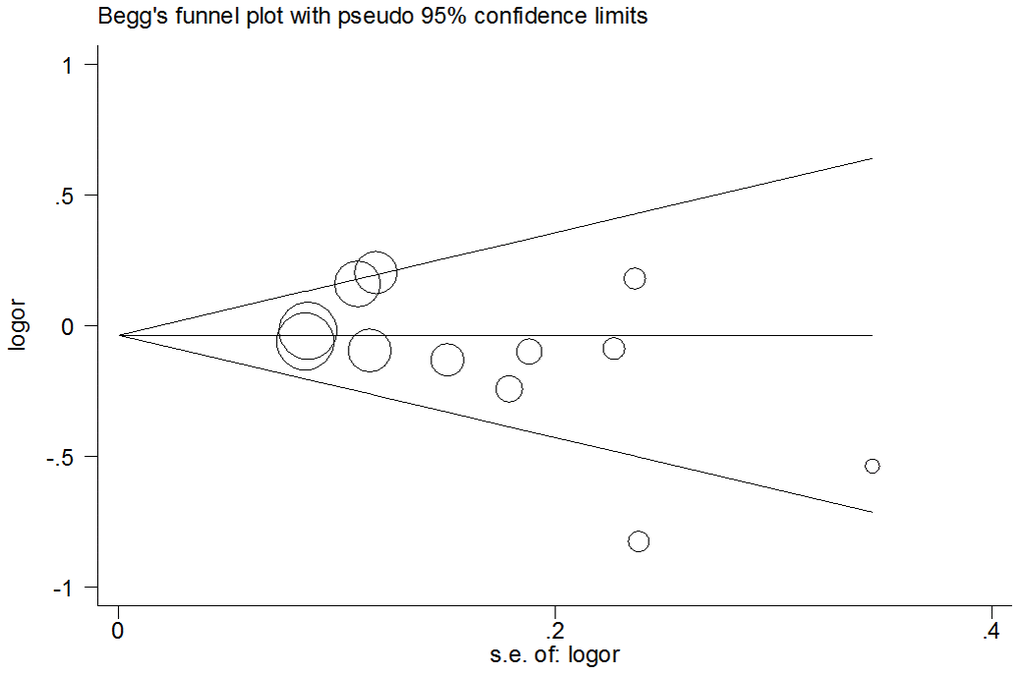
Figure 5.
Funnel plot analysis to detect publication bias for over-dominant model of pri-miR-26a-1 rs7372209 C>T polymorphism.
Circles represent the weight of the studies.