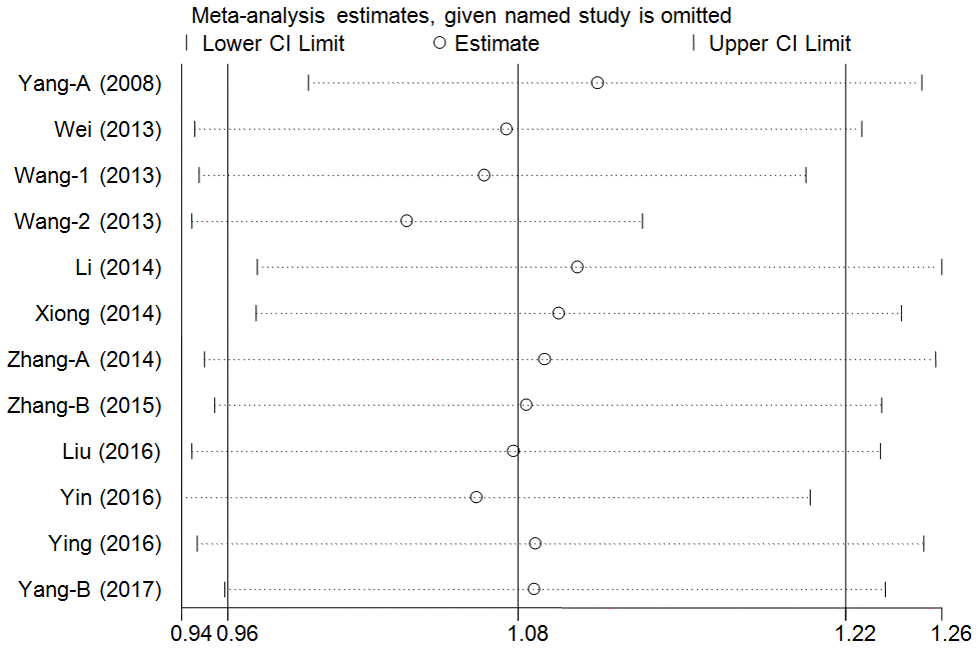
Figure 4.Sensitivity analysis through deleting each study to reflect the influence of the individual dataset to the pooled ORs in over-dominant model of pri-miR-26a-1 rs7372209 C>T polymorphism.
Figure 4 — Association between the pri-miR-26a-1 rs7372209 C>T polymorphism and cancer susceptibility: multivariate analysis and trial sequential analysis | Aging