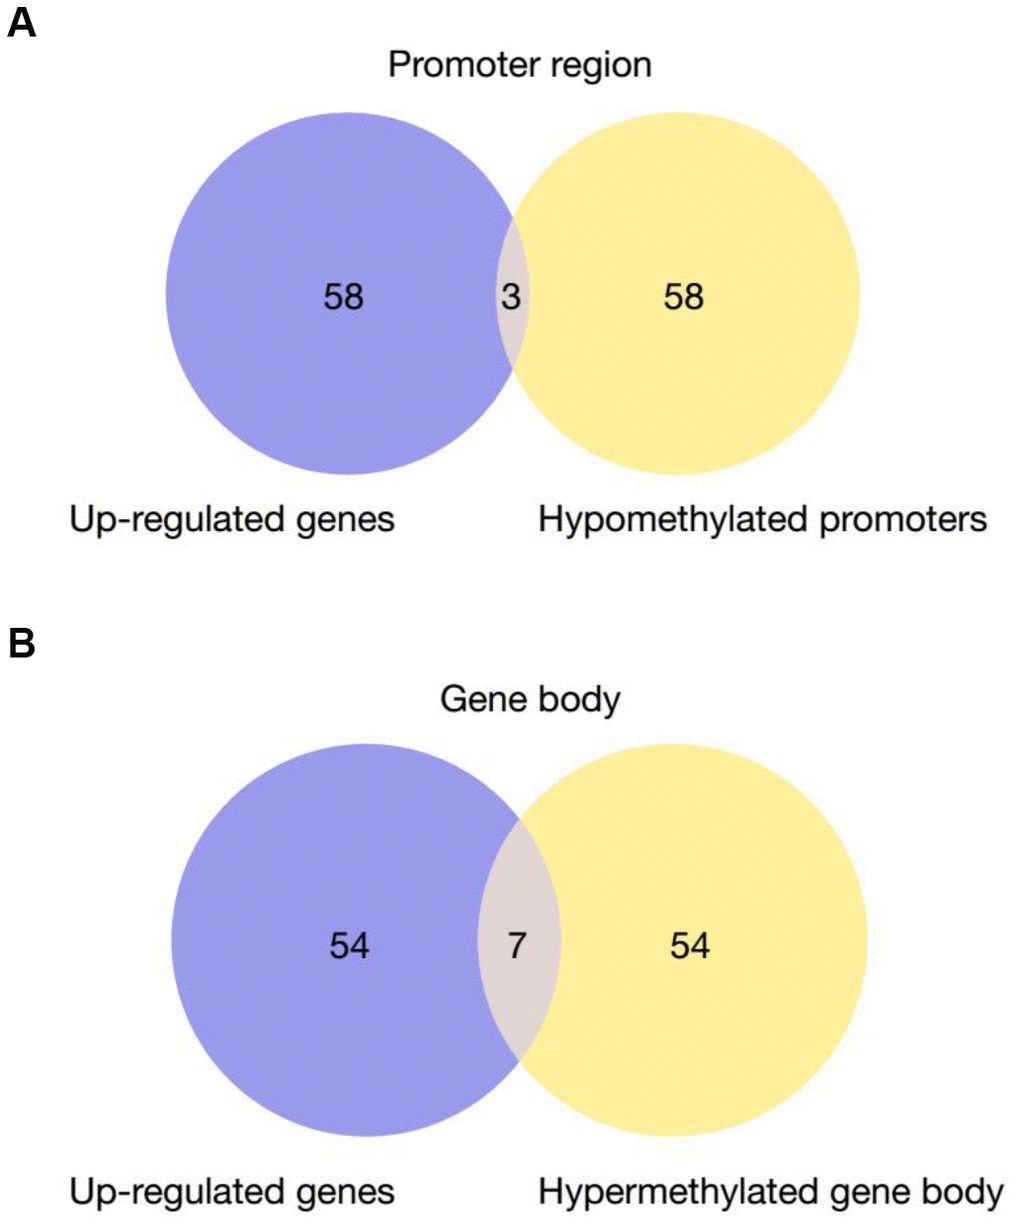
Figure 5.Venn Diagram of up-regulated genes in PD patients that have hypomethylated promoters (A) or gene bodies (B) Fisher’s exact test is used for the comparison of preference of methylation at gene body versus promoter. P-value = 0.0029.
Figure 5 — The association of serum vitamin K2 levels with Parkinson's disease: from basic case-control study to big data mining analysis | Aging