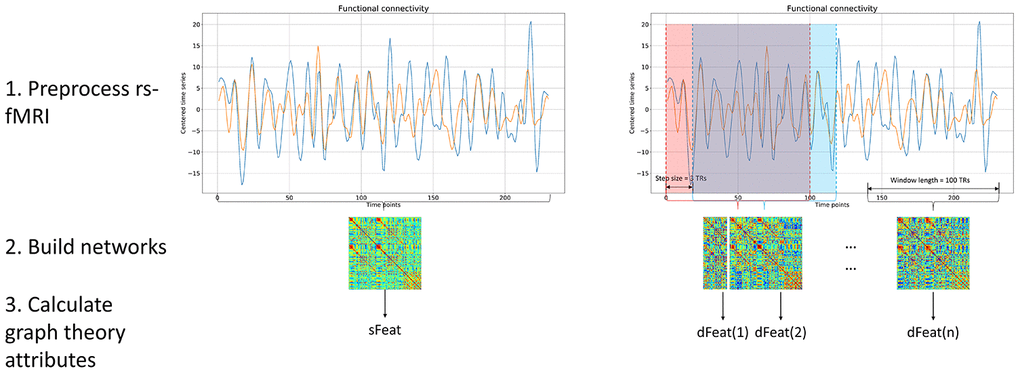
Figure 6.Processing pipeline. Both static and dynamic functional connectivity was calculated based on BOLD fMRI signal. For static functional connectivity, the pair-wise Pearson correlation between two regions was obtained using the whole time series. For dynamic functional connectivity, we utilized the sliding window method to produce a range of functional networks. After network construction, graph theory attributes were calculated based on each functional networks, yielding sFeat for static feature, and dFeats for dynamic features.