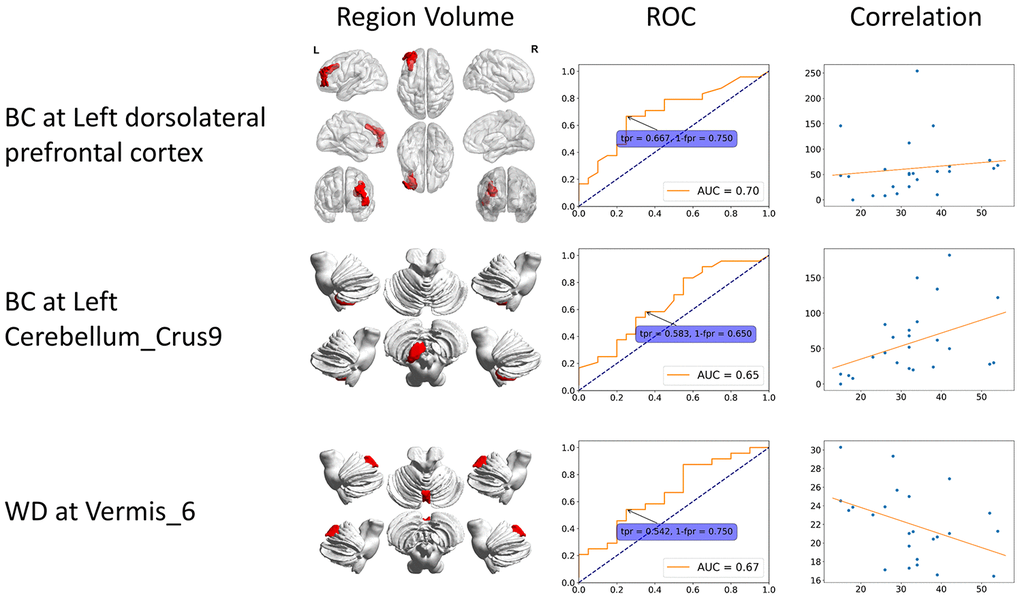
Figure 3.Static specific significant features. These features can only be identified from static functional connectivity. The 3D region volume was shown, as well as the ROC curve and correlation with clinical scores. The correlation is between clinical score (x-axis) and features (y-axis). BC: betweenness centrality; CCFS: clustering coefficient; LE: local efficiency; WD: weighted degree.