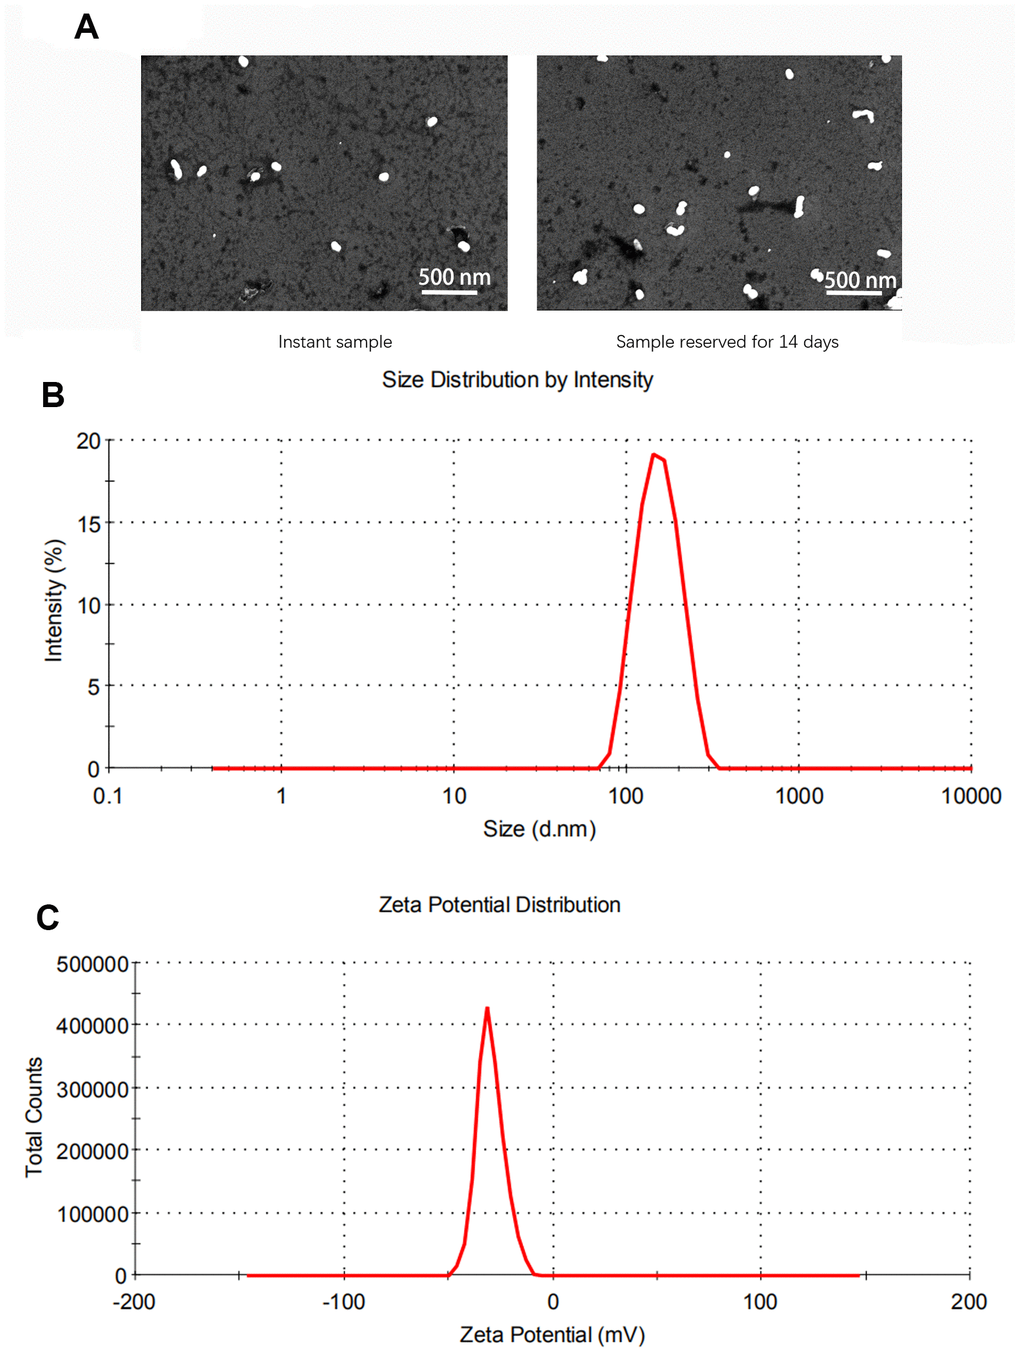
Figure 1.Characterization of solid lipid nanoparticles (SLNs). (A) The representative images of SLNs using transmission electron microscopy. (B) The size distribution of SLNs. (C) The zeta potential distribution of SLNs.
Figure 1 — Cationic solid lipid nanoparticles loaded by integrin β1 plasmid DNA attenuates IL-1β-induced apoptosis of chondrocyte | Aging