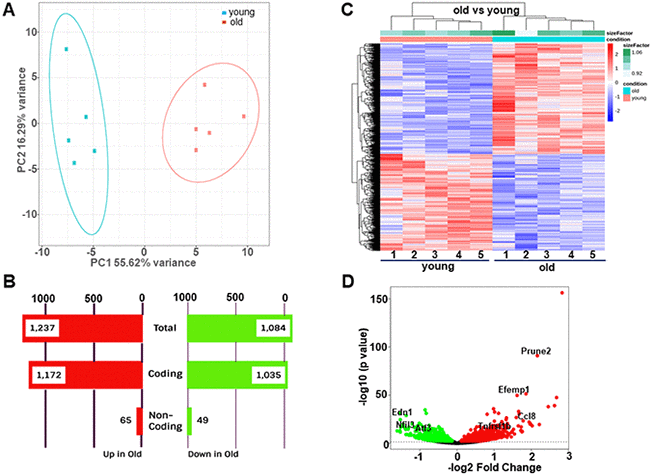
Figure 1.Differential gene expression between young (14.5 weeks) and old (92.4 weeks) mouse aortae. (A) Principal component analysis (PCA) showing distinct separation of young and old groups. (B) Number of differentially expressed transcripts in young versus old aortae. (C) Heatmap of hierarchical clustering analysis based on the log2 transformation of the normalized count data. (D) Volcano plots showing -log10 (p value) versus -log2 (fold change) of normalized counts between young and old groups. Each dot represented a single transcript. Red dots denoted significant upregulated genes whereas green dots denoted significant downregulated genes (adjusted p<0.05). Several most dramatically altered genes were marked.