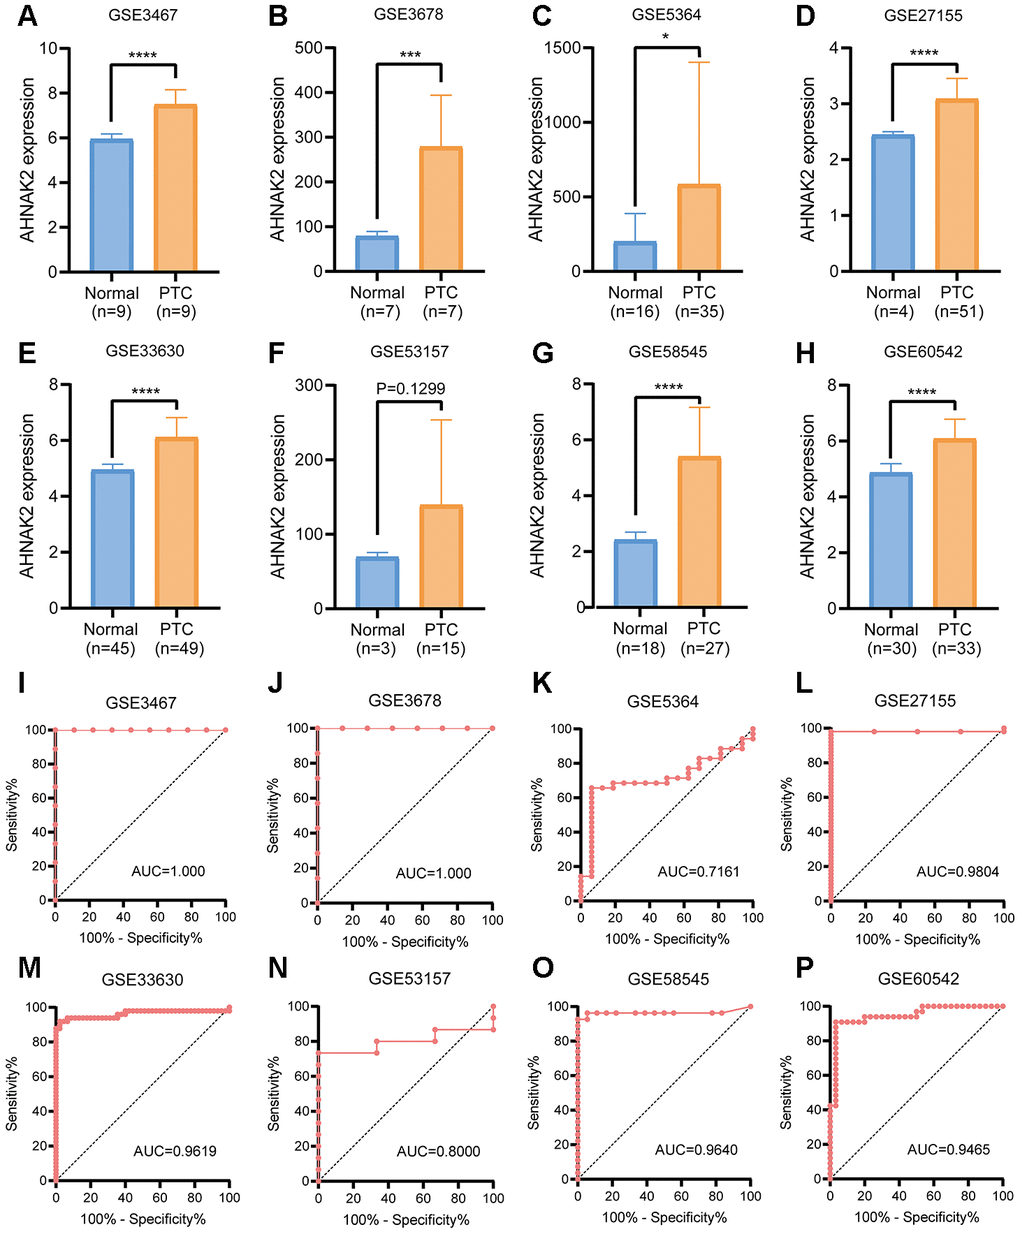
Figure 6.GEO verification of the diagnostic value of AHNAK2 in PTC. (A–H) mRNA expression levels of AHNAK2 in 8 GEO verification cohorts (GSE3467, GSE3678, GSE5364, GSE27155, GSE33630, GSE58545, GSE53157, and GSE60542). (I–P) ROC curves were generated to verify the diagnostic performance of AHNAK2 expression in the verification cohorts.