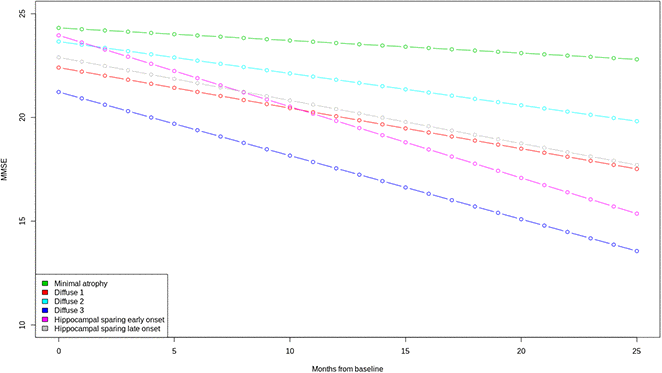
Figure 3.Trajectories of MMSE total scores over time. A mixed effect model estimated the MMSE total score differences between the six clusters at baseline and over time. Linear trend over time was assumed. Clear differences in the trajectories of MMSE were observed between the Minimal atrophy and Hippocampal sparing early onset/Diffuse 3 clusters. MMSE: Mini Mental State Examination.