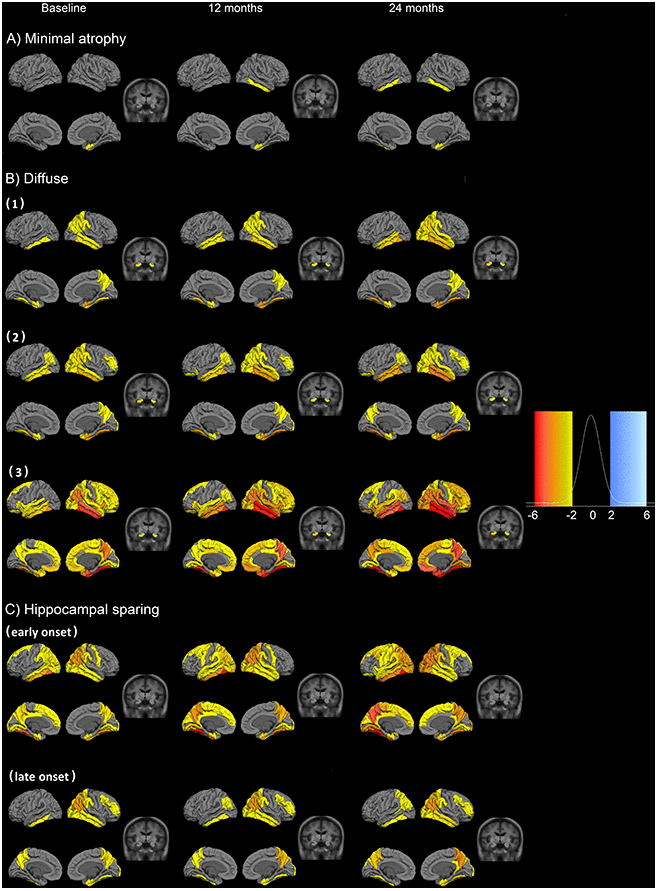
Figure 2.Fitted values for cortical thickness and subcortical volumes for the different patterns of atrophy. Atrophy fitted values of the six longitudinal atrophy patterns for the AD sample. Each row presents the median fitted values of the cortical and subcortical atrophy of the six components for three time points (baseline, 12 and 24 months from the first measurement). The data are presented as cognitively unimpaired group z-scores. (A) minimal atrophy pattern, (B) diffuse AD atrophy pattern, (C) hippocampal sparing AD atrophy pattern. Fixed effects: Intracranial volume = average Intracranial volume, Sex= female, Age = 75 years, Time from onset of dementia = 5 years, Education = 16 years, CSF Aβ1-42 = 100 pg/ml, CSF pTau 181P = 50 pg/ml. Data are presented as standard deviations below the estimated mean of the healthy cognitively unimpaired population.