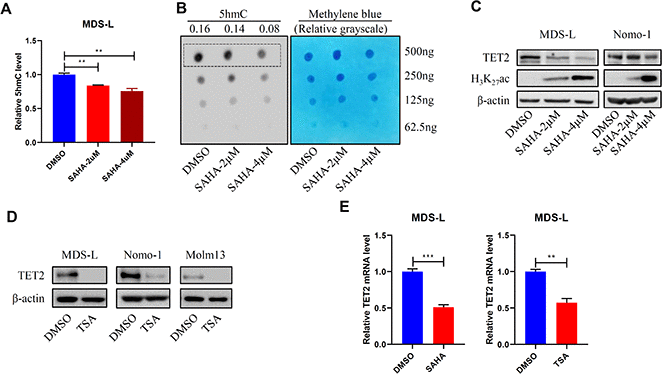
Figure 2.HDACi treatment promotes DNA hypermethylation. (A, B) MDS-L cells were treated with 2 or 4 μM SAHA for 24 hours, and then 5hmC levels were determined by ELISA (A) or dot blot (B). (C, D) MDS-L, Nomo-1 or Molm13 cells were treated with 2 or 4 μM SAHA (C) or 1 μM TSA (D) for 24 hours, and then TET2 protein levels were determined by Western blot. In (C) H3K27Ac served as a positive control indicative of HDAC inhibition. (E) TET2 mRNA levels in 2 μM SAHA- or 1 μM TSA-treated MDS-L cells, as detected by RT-qPCR.