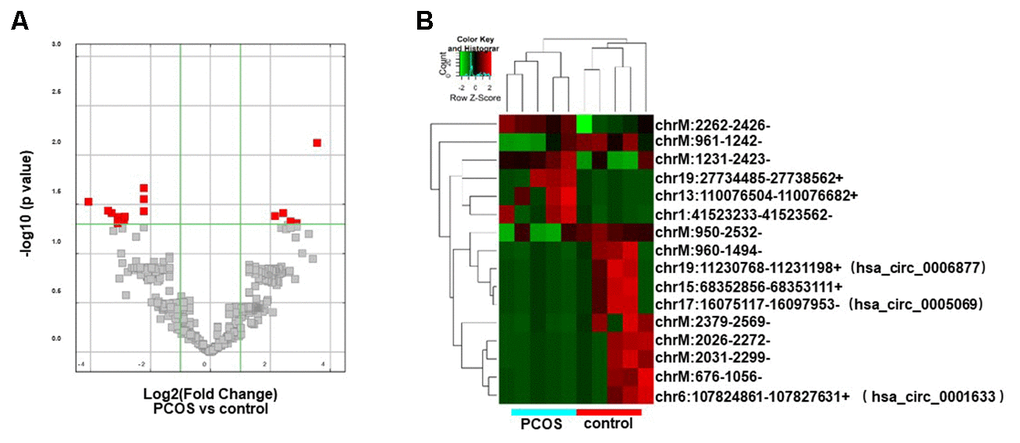
Figure 2.Differentially expressed circRNA analysis. (A) Volcano plot showing the distribution of circRNA differential expression according to their p values and fold-changes. Candidates with p< 0.05 and fold change >= 2 are highlighted in red. (B) Heat map showing hierarchical clustering analysis of circRNA candidates in follicular exosomes isolated from PCOS and control donors.