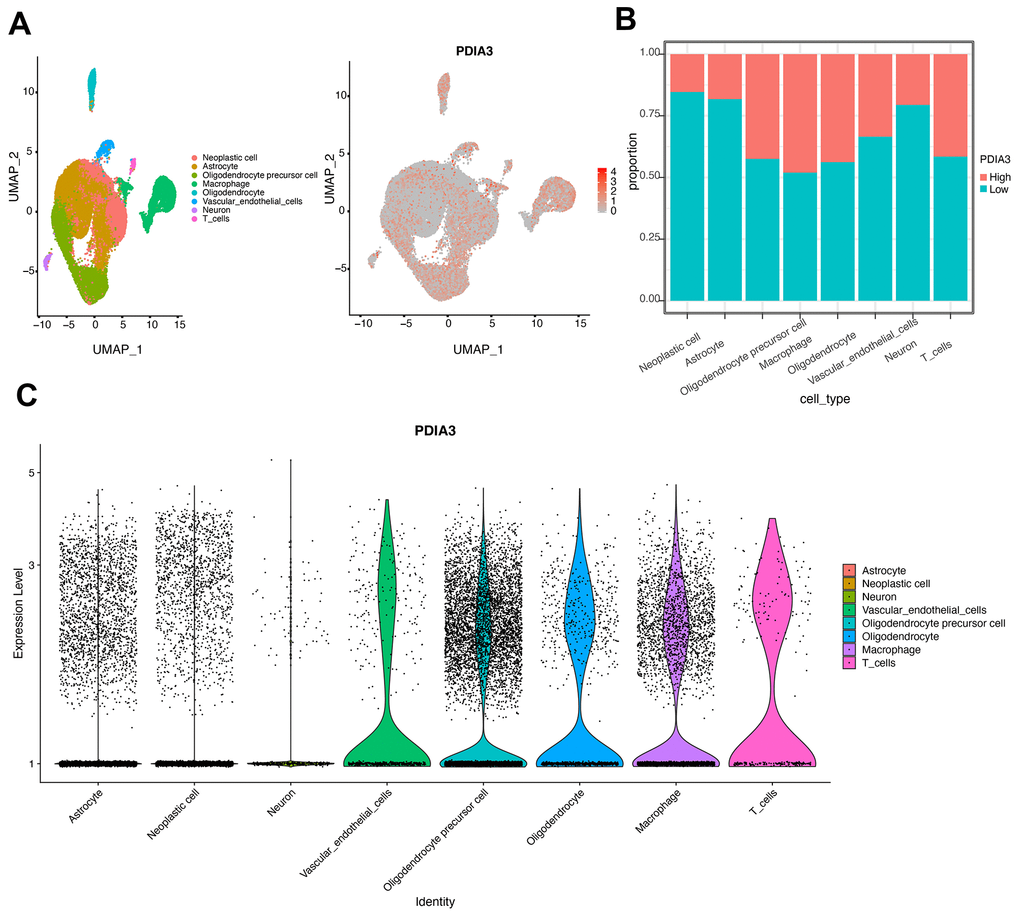
Figure 5.Identification of cell types in single cell sequencing analysis. (A) UMAP plot of tumor cells showing eight clusters with patient effects regressed out. Gray area represents the whole cell clusters. The red dot represents cell with PDIA3 expression. (B) The proportion of cells with PDIA3high or PDIA3low expression in eight cell clusters. (C) The expression level of PDIA3 in eight cell clusters.