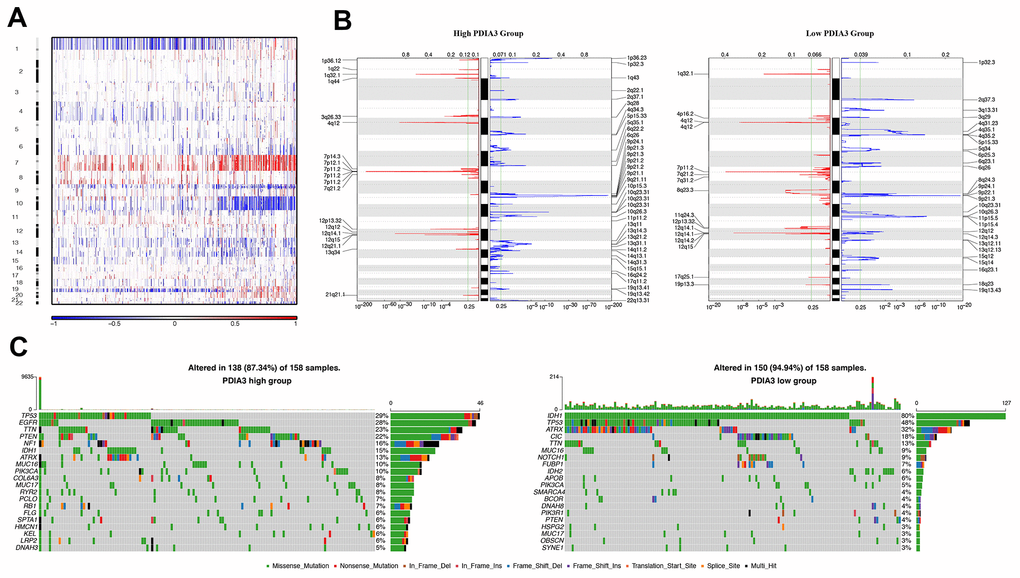
Figure 3.Distinct genomic profiles correlated with PDIA3 expression. (A) The overall CNAs profile arranged by high and low PDIA3 expression. Blue (deletion); red (amplification). (B) Frequency of amplifications and deletions in gliomas. Deletion is blue and amplification is red. (C) Distinct somatic mutations in gliomas.