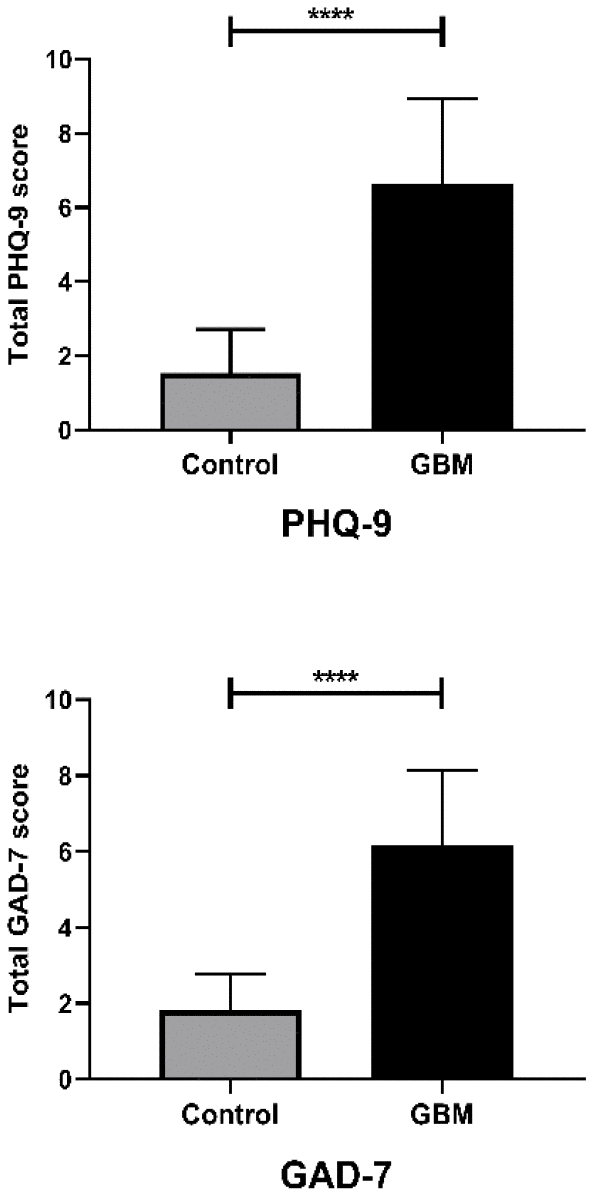
Figure 1.Questionnaire results differed between GBM patients and controls, and between genders. Bar plot comparing the PHQ-9 and GAD-7 questionnaire results between the control and GBM groups; ****, P < 0.0001. Student’s t-test was used for statistical analysis.