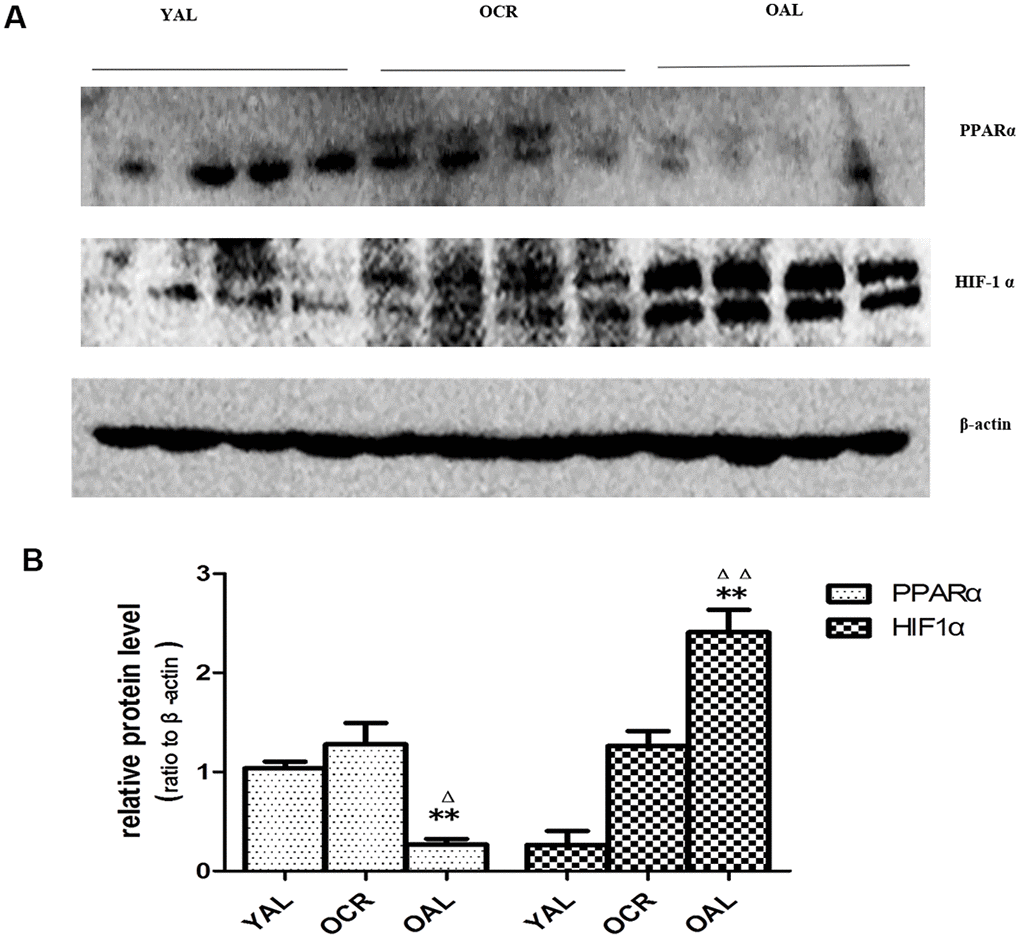
Figure 7.Expression of PPARα and HIF-1α in the kidneys of three groups. (A) Western blot results for PPARα and HIF-1α protein. (B) Quantitative analysis of band density for PPARα and HIF-1α. Data are presented as mean ± SD (n=4). * p < 0.05 (OAL vs YAL); Δp < 0.05 (OCR vs OAL). **/ΔΔp < 0.01.