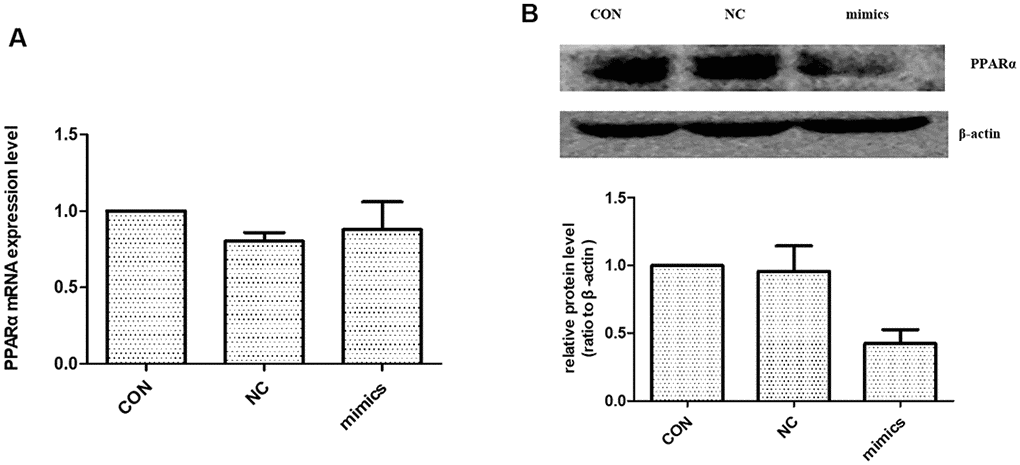
Figure 6.The effect of miR-21 on PPARα expression. (A) PPARα mRNA expression level were detected with Real-time PCR. (B) PPARα protein expression level was detected with Western blot. CON: normal culture condition; NC: miR negative control; Mimics: miR-21 mimics. * p<0.01(mimic group vs CON group), n=3.