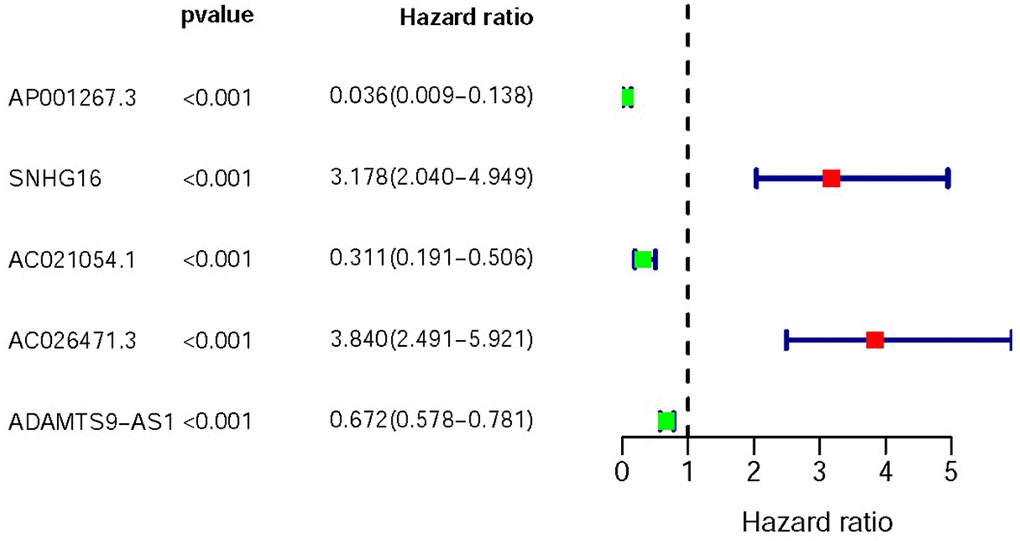
Figure 1.Survival-related values of sIRlncRs. Forest plot of hazard ratios showing the survival-related values of sIRlncRs (AP001267.3, SNHG16, AC021051.1, AC026471.3 and ADAMTS9-AS1). Red parts represent upregulated sIRlncRs, and green parts represent downregulated sIRlncRs.