Submit an Article
Navigate
Home
Editorial Board
Editorial Policies
Current Volume
Archive
Scientific Integrity
Publication Ethics Statements
Interviews with Outstanding Authors
Newsroom
Sponsored Conferences
Podcast
Contact
Special Collections
Submit an Article
Online ISSN: 1945-4589
Research Paper
|
Volume 12, Issue 14
|
pp. 14949–14965
Analysis of plasma metabolic profile, characteristics and enzymes in the progression from chronic hepatitis B to hepatocellular carcinoma
Back to article
Figure 6
(6 of 9)
−
100%
+
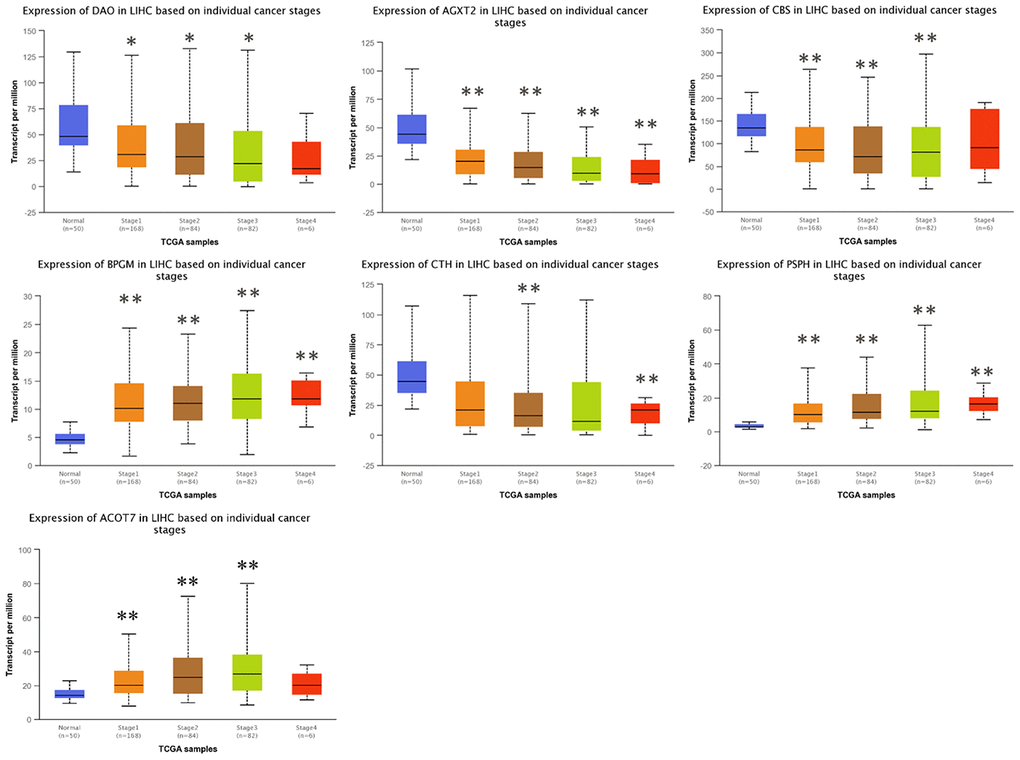
Figure 6.
Correlation between the expressions of
AGXT2
,
DAO
,
CTH
,
BPGM
,
CBS
,
PSPH
, and
ACOT7
mRNAs and Individual cancer stages in HCC.
*
P
< 0.05, **
P
< 0.01.