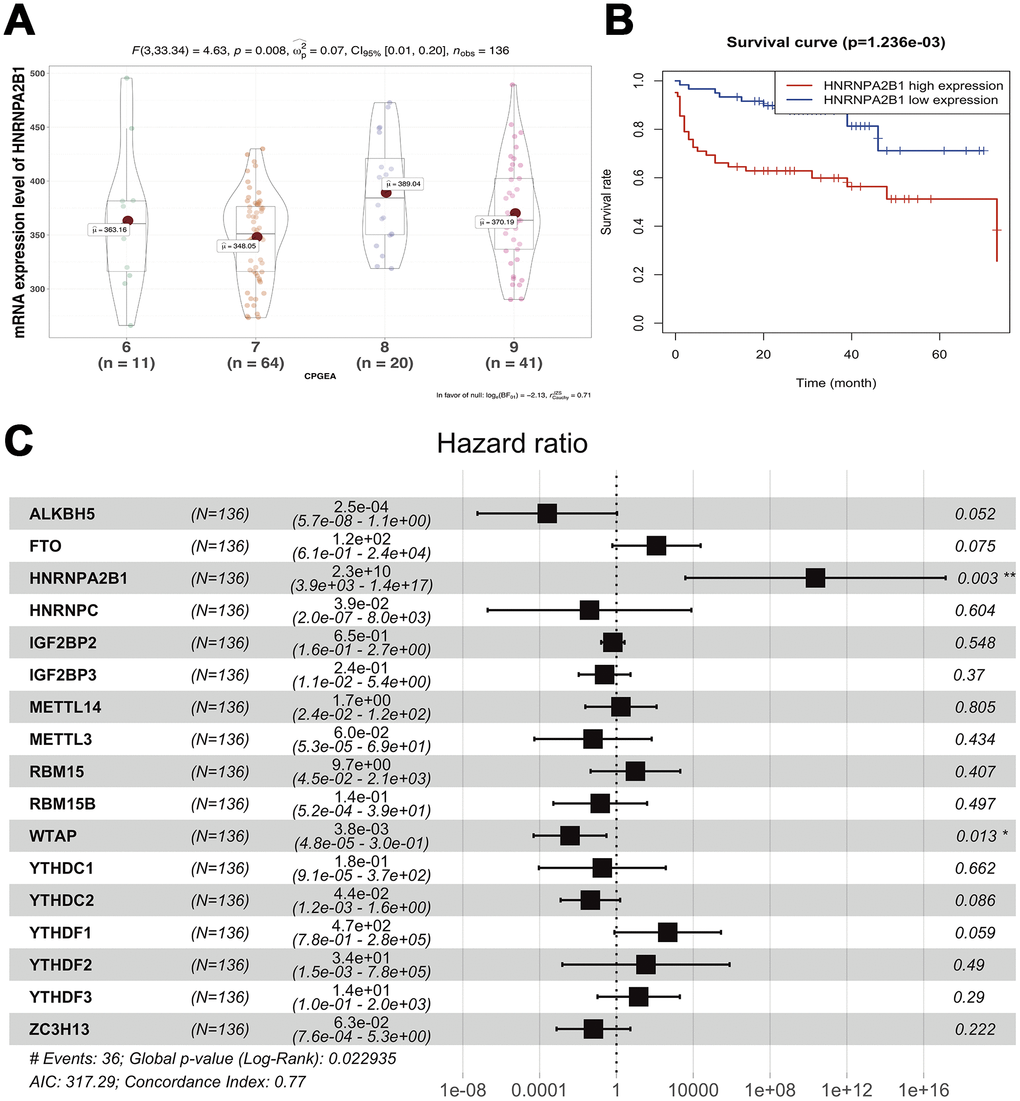
Figure 5.Survival analysis of expression of m6A methylation regulators. (A) correlation between expression of HNRNPA2B1 and GS; (B) Univariable cox regression analysis of HNRNPA2B1; (C) Multivariable cox regression analysis of all m6a methylation regulators.