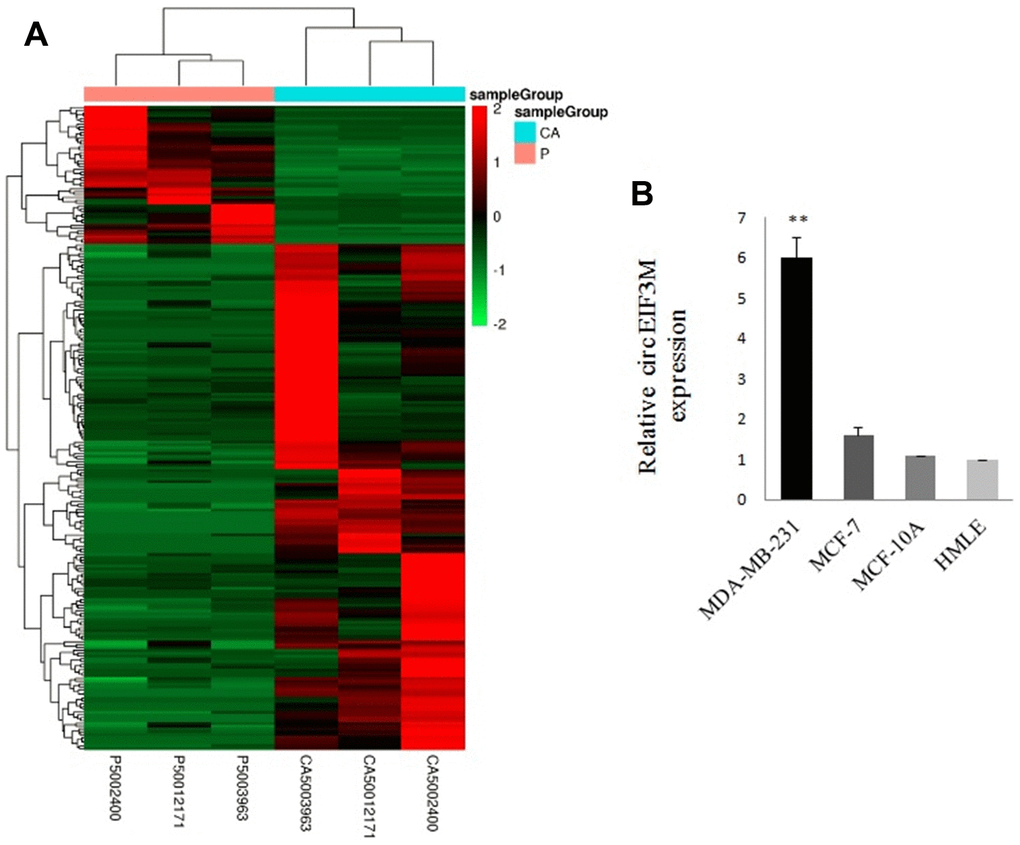
Figure 1.Overview of circRNA profiles (CA: TNBC tissues; P: normal breast tissues). (A) Hierarchical cluster analysis of differentially expressed circRNAs. The red and green colors indicate high and low expression, respectively. (B) Relative expression of circEIF3M in cell lines was determined by qRT-PCR. **P < 0.01.