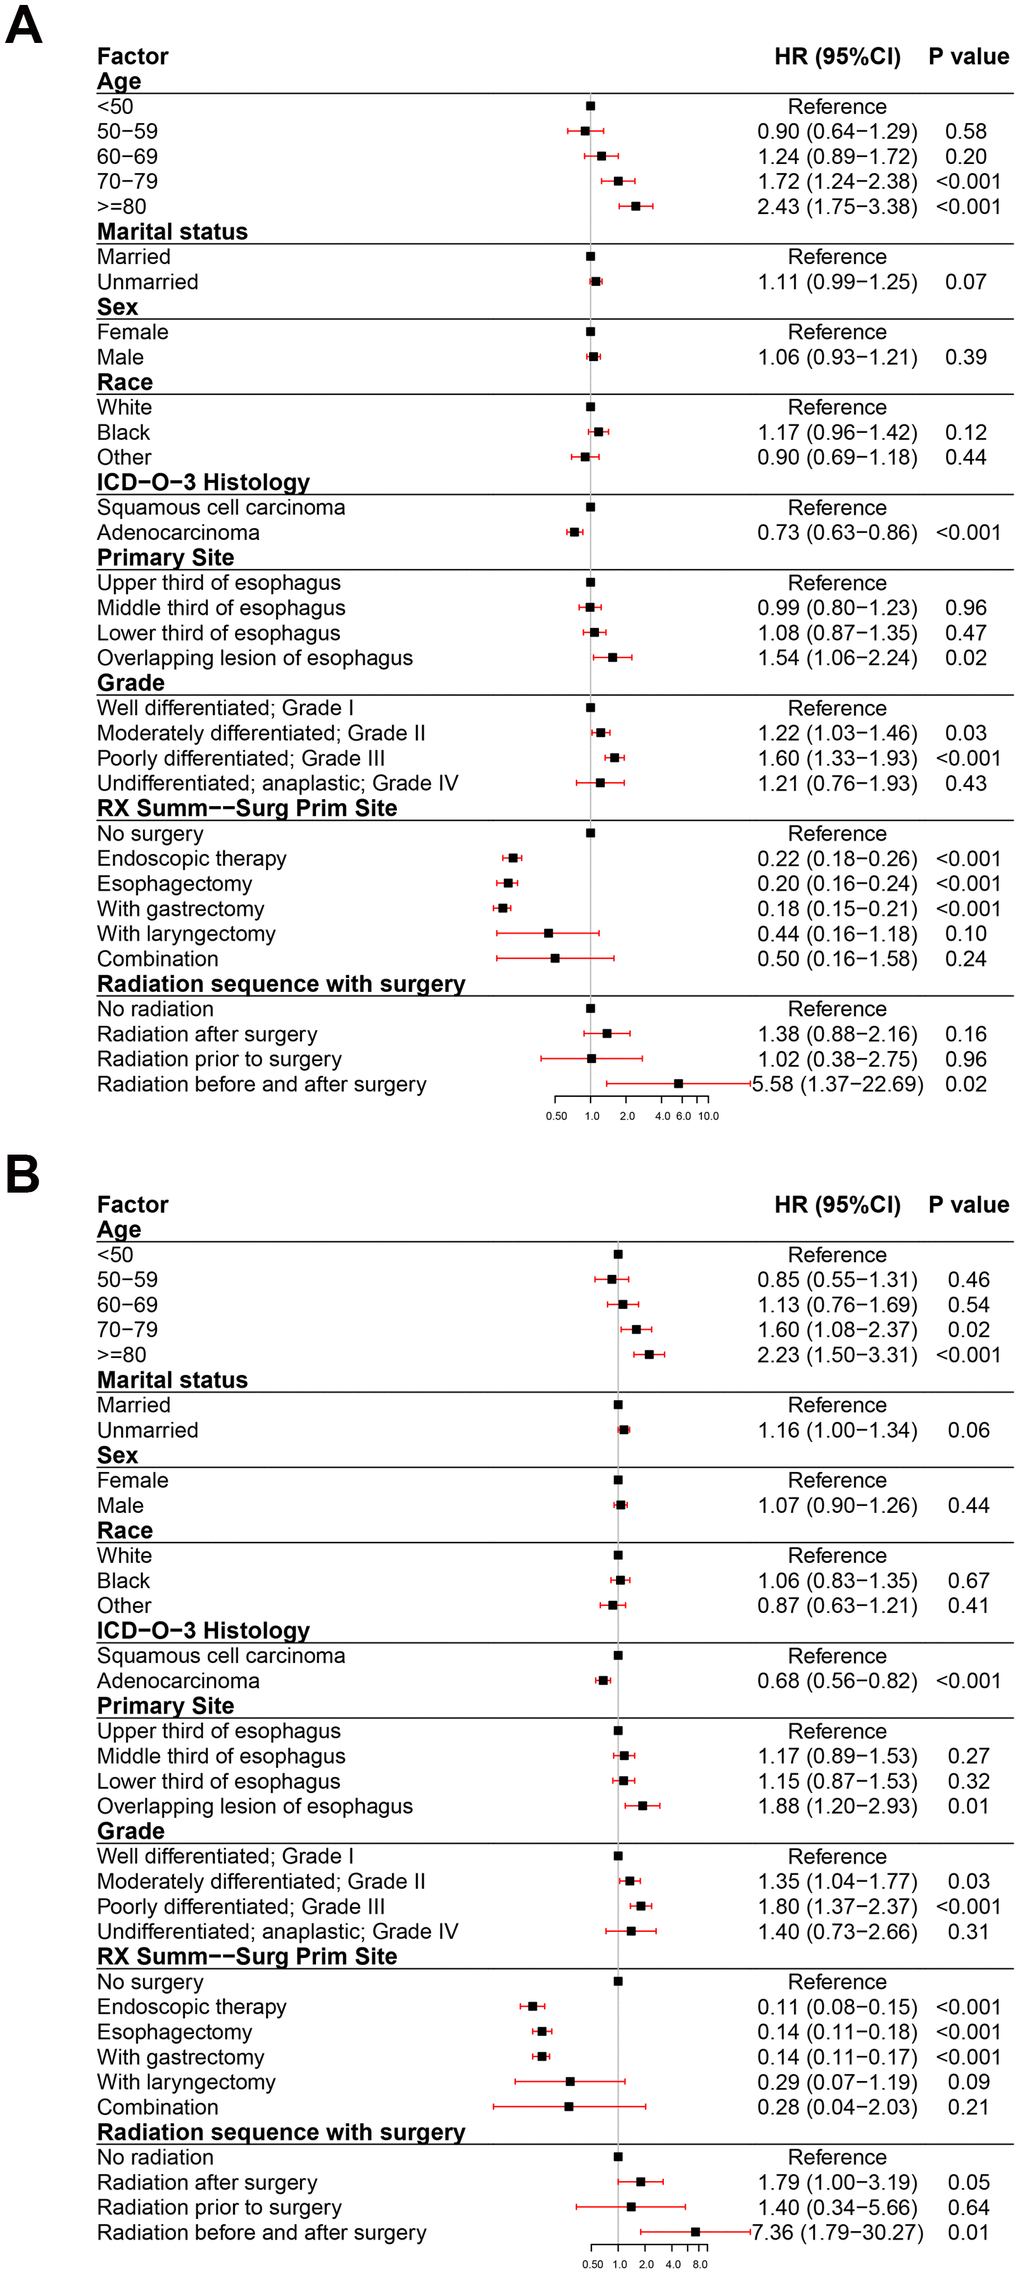
Figure 3.Forest plot of the multivariate analysis data of stage I esophageal cancer patients using the Cox proportional hazards model. (A) Multivariate analysis of the overall survival for stage I EC patients. (B) Multivariate analysis of the esophageal cancer-specific survival for stage I EC patients.