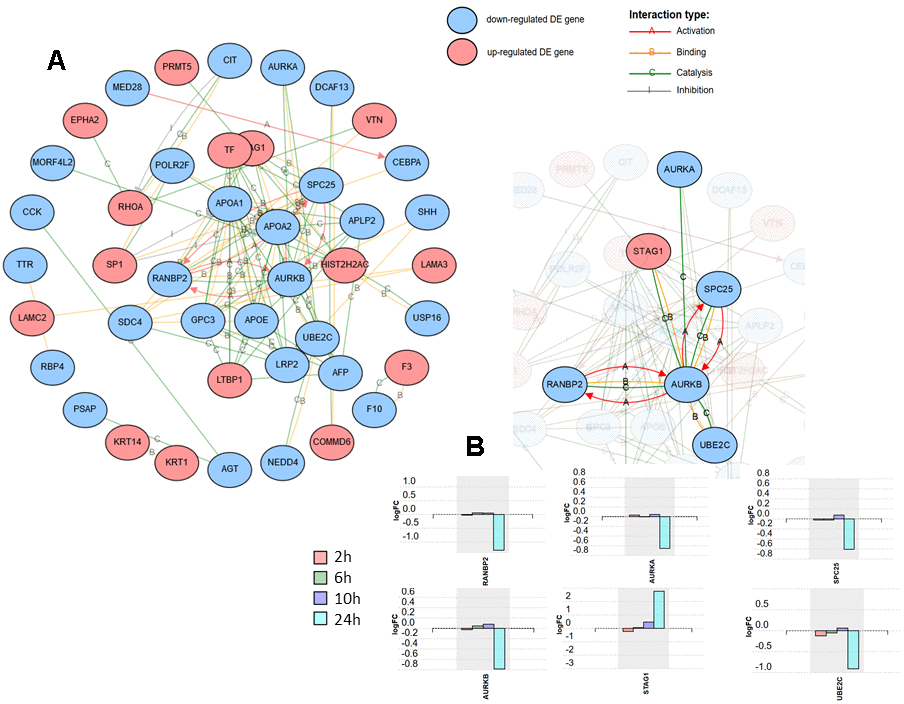
Figure 2.Network analysis including the 125 differentially expressed proteins at 24 h after SARS-CoV-2 in Caco-2 cells. Activation, binding, catalysis, and inhibition regulatory interactions are included. (A) Network with the isolated nodes hidden. (B) Six-protein subnetwork with the interactions for RANBP2, showing the expression changes for each time point for the six proteins.