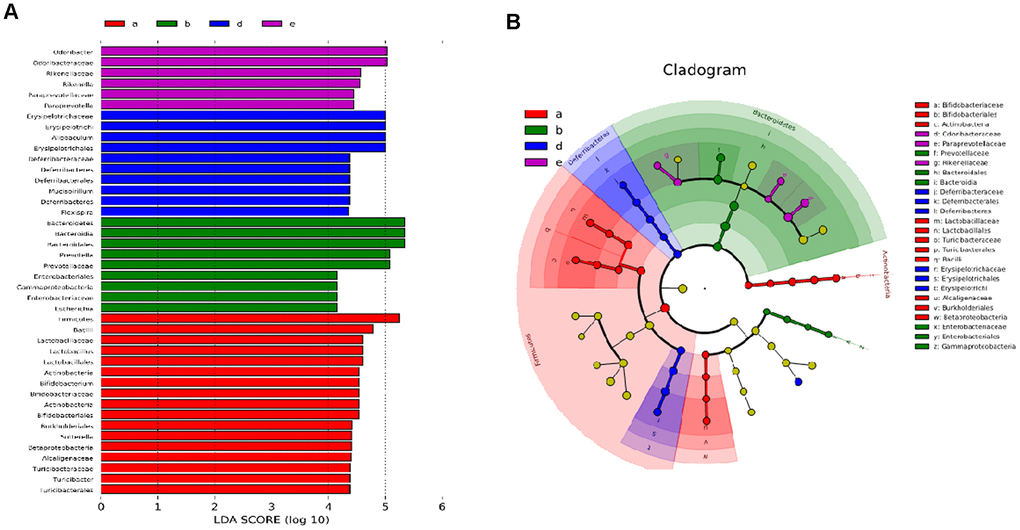
Figure 6.Effect of PSE on gut microflora of type 2 diabetic mice-induced by high-fat diet. The LDA score (A) and profiling of LEFSE (B) analysis. Letters a, b, d, and e in the graph represent 10 mg/kg PSE-treated, 80 mg/kg PSE-treated, the diabetes model, and 140 mg/kg MET-treated groups, respectively.