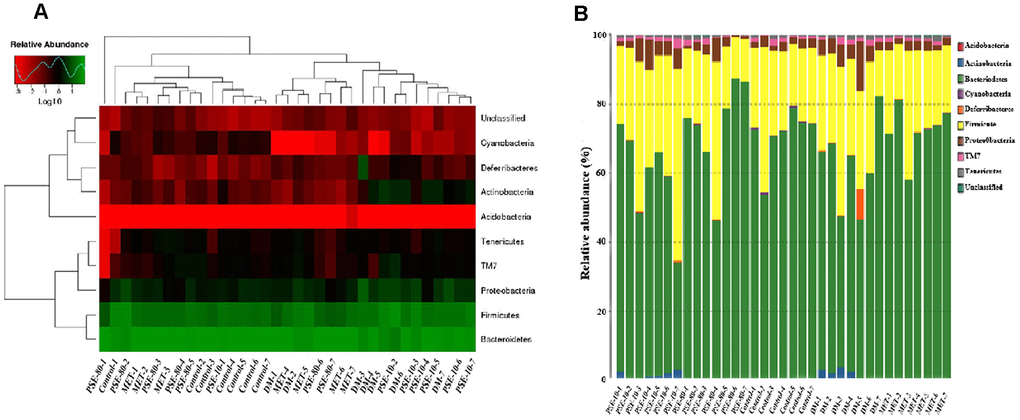
Figure 4.Effect of PSE on gut-microbiota composition of type 2 diabetic mice-induced by high-fat diet at phyma level. The heatmap of class level species abundance (A). Histogram of species profiling at the phyma classification level (B). Column height represents relative abundance.