Submit an Article
Navigate
Home
Editorial Board
Editorial Policies
Current Volume
Archive
Scientific Integrity
Publication Ethics Statements
Interviews with Outstanding Authors
Newsroom
Sponsored Conferences
Podcast
Contact
Special Collections
Submit an Article
Online ISSN: 1945-4589
Research Paper
|
Volume 12, Issue 18
|
pp. 17958–17975
Prognostic landscape of tumor-infiltrating immune cells and immune-related genes in the tumor microenvironment of gastric cancer
Back to article
Figure 14
(14 of 14)
−
100%
+
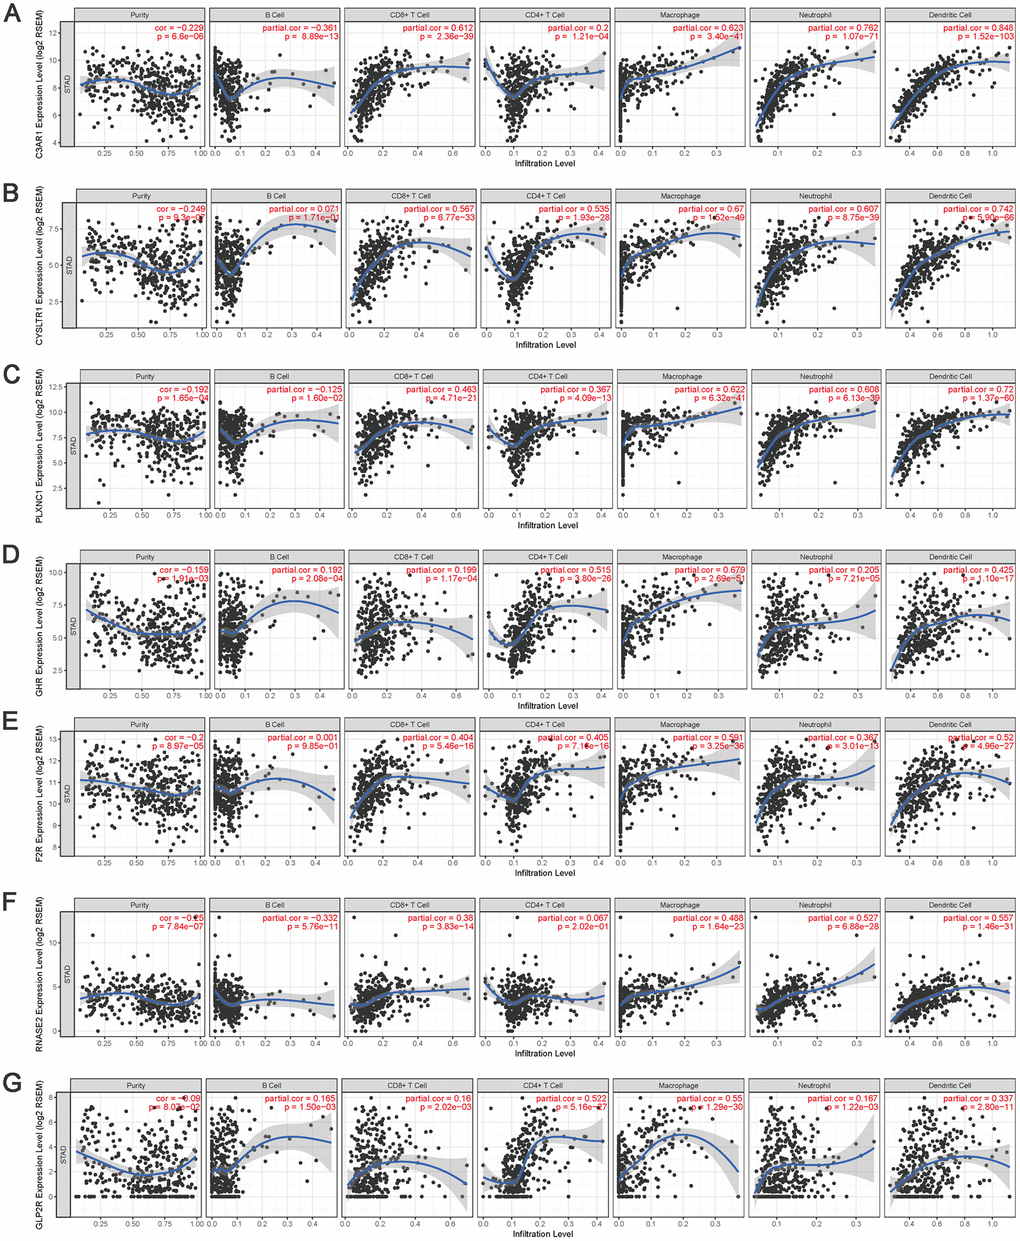
Figure 14.
The correlation between the hub IRGs and TIICs.
The expression levels of C3AR1 (
A
) CYSLTR1 (
B
) PLXNC1 (
C
) GHR (
D
) F2R (
E
) RNASE2 (
F
) and GLP2R (
G
) and their associations with the infiltration levels of immune cells.