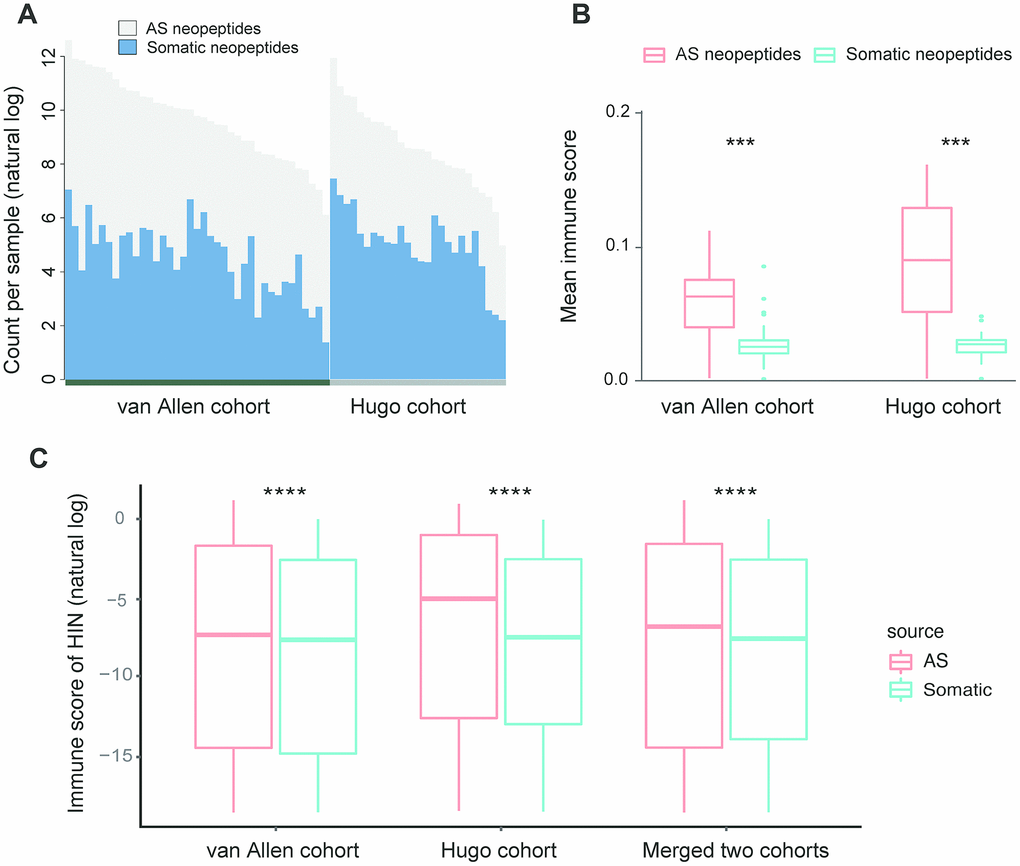
Figure 4.Comparison of AS neopeptides with somatic neopeptides. (A) The number of somatic neopeptides and AS neopeptides. Within each cohort, patients were sorted by total neoantigen burden. Neopeptide counts (y-axis values) were represented in natural log format. (B) In each cohort, AS neopeptides showed a higher mean immune score profile than that of somatic neopeptides (van Allen cohort: Wilcoxon test P=1.5e-08; Hugo cohort: Wilcoxon test P=9.1e-06). (C) Using HIN, AS neopeptides showed a significant higher immune score than that of somatic neopeptides in both van Allen cohort and Hugo cohort as well as in merged two cohorts (Wilcoxon test, P<2.2e-16 for all). The immune scores of neopeptides (y-axis values) were represented in natural log format. HIN: high immune neopeptides.